

Question: Please answer 11-3 luarterback Data TA Count (Event) Meters per Player Team Rating Sale Attempt Points Price 17 Philip Rivers SD 7.67 105.5 1000 24
Please answer 11-3
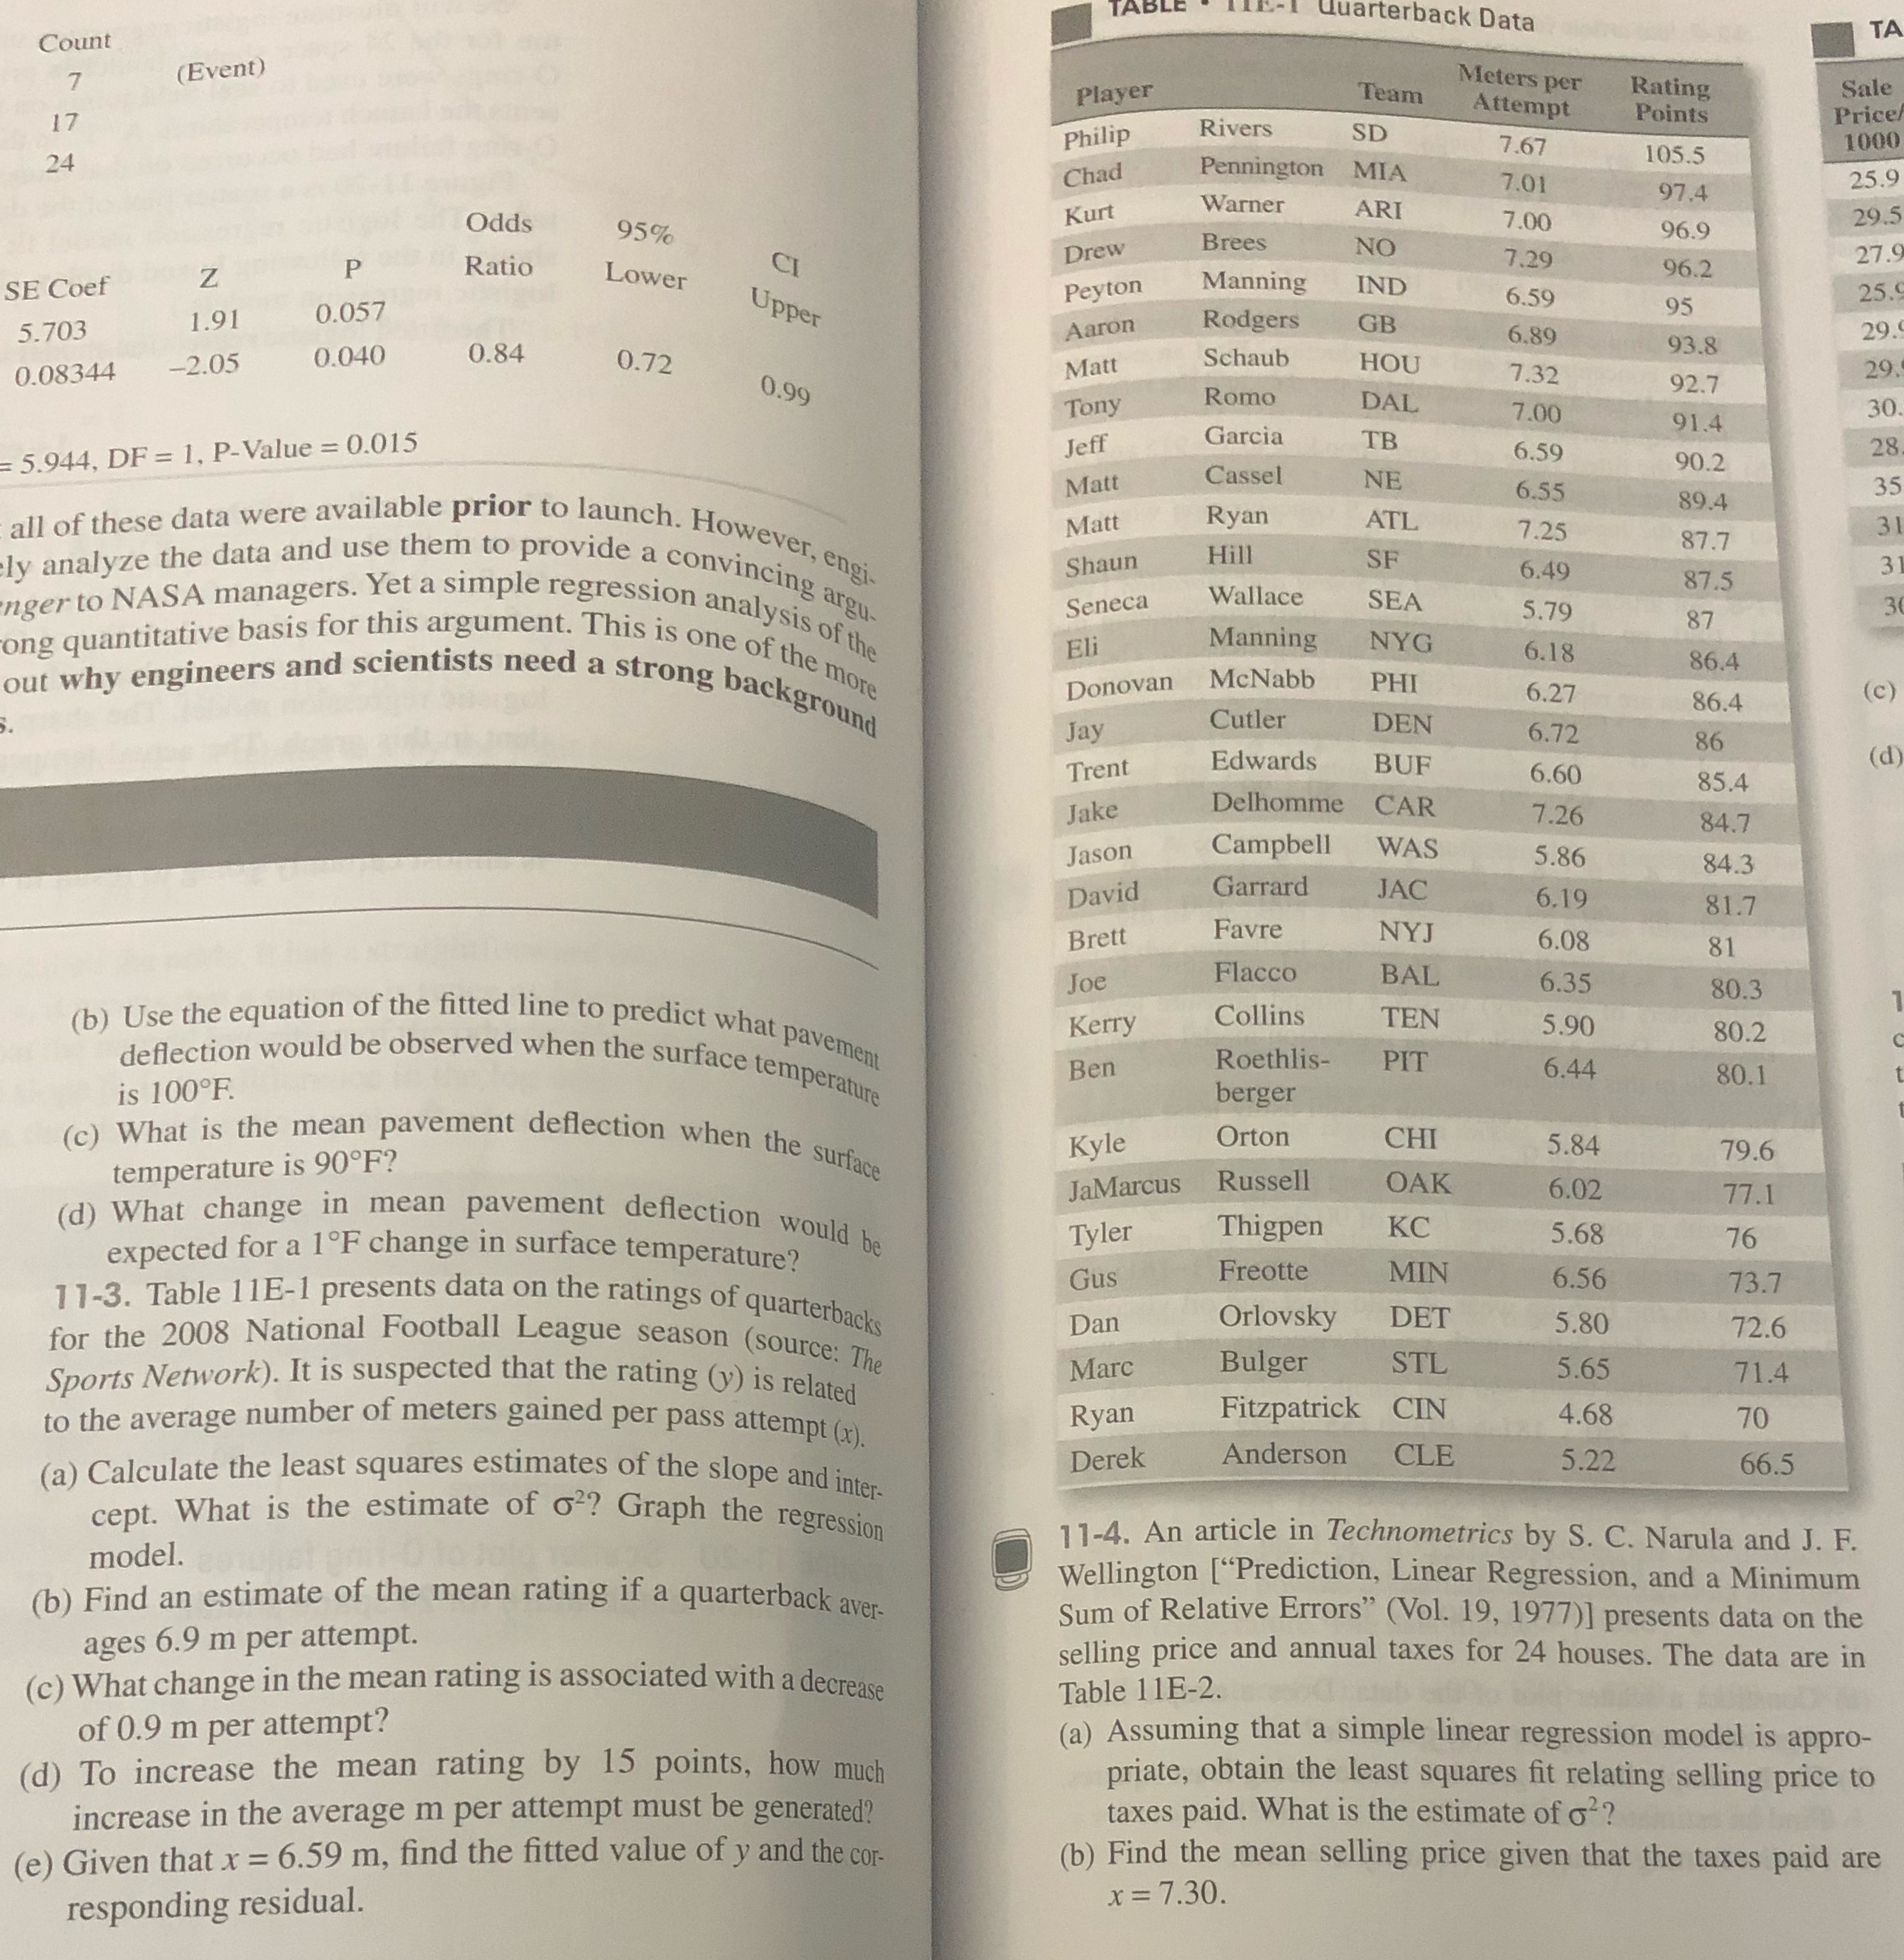
luarterback Data TA Count (Event) Meters per Player Team Rating Sale Attempt Points Price 17 Philip Rivers SD 7.67 105.5 1000 24 Chad Pennington MIA 7.01 97.4 25.9 Kurt Warner ARI Odds 7.00 29. 95% 96.9 Drew Brees NO 7.29 Z Ratio 96.2 27. P Lower CI Peyton Manning IND SE Coef 5.59 Upper 95 25. 1.91 0.057 Aaron Rodgers GB 6.89 29 . 5.703 93.8 0.040 0.84 0.08344 2.05 0.72 Mat Schaub HOU 7.32 29. 92.7 0.99 Tomy Romo DAI 7.00 91.4 30 28 = 5.944, DF = 1, P-Value = 0.015 Jeff Garcia TB 6.59 90.2 Matt Cassel NE 6.55 89.4 all of these data were available prior to launch. However, engi Matt Ryan ATL 7.25 87.7 ly analyze the data and use them to provide a convincing argu. Shaun Hill SF 6.49 87.5 iger to NASA managers. Yet a simple regression analysis of the Seneca Wallace SEA 5.79 ong quantitative basis for this argument. This is one of the more Eli Manning NYG 6.18 but why engineers and scientists need a strong background 86.4 Donovan McNabb PHI 6.27 86.4 ( C ) Jay Cutler DEN 6.72 86 Trent Edwards BUF 6.60 85.4 Jake Delhomme CAR 7.26 84.7 Jason Campbell WAS 5.86 84.3 David Garrard JAC 6.19 81.7 Brett Favre NYJ 6.08 81 Joe Flacco BAL 6.35 80.3 (b) Use the equation of the fitted line to predict what pavement Kerry Collins TEN 5.90 80.2 deflection would be observed when the surface temperature Ben Roethlis- PIT 6.44 80.1 is 100 F. berger (c) What is the mean pavement deflection when the surface Kyle Orton CHI 5.84 79.6 temperature is 90 F? JaMarcus Russell DAK 6.02 77.1 (d) What change in mean pavement deflection would be Tyler Thigpen KC 5.68 76 expected for a 1 F change in surface temperature? Gus Freotte MIN 6.56 73.7 11-3. Table 1 1E-1 presents data on the ratings of quarterbacks Orlovsky DET for the 2008 National Football League season (source: The Dan 5.80 72.6 Sports Network). It is suspected that the rating (v) is related Marc Bulger STL 5.65 71.4 to the average number of meters gained per pass attempt (x). Ryan Fitzpatrick CIN 4.68 70 (a) Calculate the least squares estimates of the slope and inter- Derek Anderson CLE 5.22 66.5 cept. What is the estimate of 62? Graph the regression 11-4. An article in Technometrics by S. C. Narula and J. F. model. Wellington ["Prediction, Linear Regression, and a Minimum (b) Find an estimate of the mean rating if a quarterback aver- Sum of Relative Errors" (Vol. 19, 1977)] presents data on the ages 6.9 m per attempt. selling price and annual taxes for 24 houses. The data are in (c) What change in the mean rating is associated with a decrease Table 11E-2. of 0.9 m per attempt? (a) Assuming that a simple linear regression model is appro- (d) To increase the mean rating by 15 points, how much priate, obtain the least squares fit relating selling price to increase in the average m per attempt must be generated? taxes paid. What is the estimate of o'? (e) Given that x = 6.59 m, find the fitted value of y and the cor- (b) Find the mean selling price given that the taxes paid are responding residual. x = 7.30
Step by Step Solution
There are 3 Steps involved in it

Get step-by-step solutions from verified subject matter experts