

Question: 1. .70 1 2 3 Education .40 Personal Attributes - Value Hierarchy Computations Top Middle Bottom .30 Appearance New Professor .20 Slob Spiffy Adequate
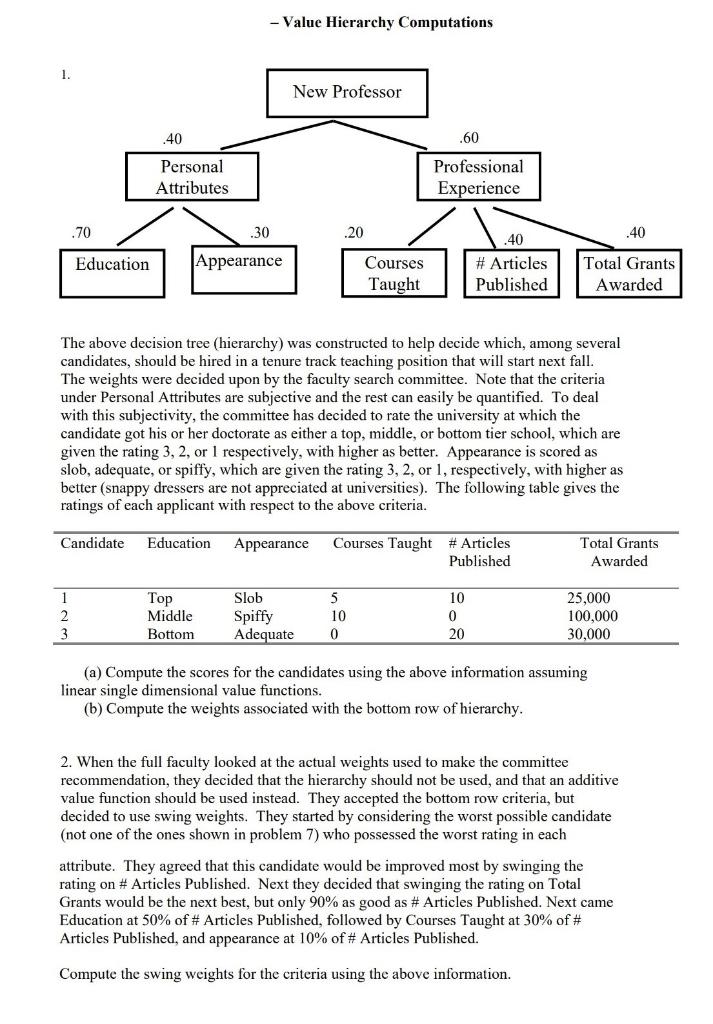
1. .70 1 2 3 Education .40 Personal Attributes - Value Hierarchy Computations Top Middle Bottom .30 Appearance New Professor .20 Slob Spiffy Adequate Courses Taught The above decision tree (hierarchy) was constructed to help decide which, among several candidates, should be hired in a tenure track teaching position that will start next fall. The weights were decided upon by the faculty search committee. Note that the criteria under Personal Attributes are subjective and the rest can easily be quantified. To deal with this subjectivity, the committee has decided to rate the university at which the candidate got his or her doctorate as either a top, middle, or bottom tier school, which are given the rating 3, 2, or 1 respectively, with higher as better. Appearance is scored as slob, adequate, or spiffy, which are given the rating 3, 2, or 1, respectively, with higher as better (snappy dressers are not appreciated at universities). The following table gives the ratings of each applicant with respect to the above criteria. Candidate Education Appearance Courses Taught 5 10 0 60 Professional Experience .40 # Articles Published # Articles Published 10 0 20 .40 Total Grants Awarded Total Grants Awarded 25,000 100,000 30,000 (a) Compute the scores for the candidates using the above information assuming linear single dimensional value functions. (b) Compute the weights associated with the bottom row of hierarchy. 2. When the full faculty looked at the actual weights used to make the committee recommendation, they decided that the hierarchy should not be used, and that an additive value function should be used instead. They accepted the bottom row criteria, but decided to use swing weights. They started by considering the worst possible candidate (not one of the ones shown in problem 7) who possessed the worst rating in each attribute. They agreed that this candidate would be improved most by swinging the rating on # Articles Published. Next they decided that swinging the rating on Total Grants would be the next best, but only 90% as good as # Articles Published. Next came Education at 50% of # Articles Published, followed by Courses Taught at 30% of # Articles Published, and appearance at 10% of # Articles Published. Compute the swing weights for the criteria using the above information.
Step by Step Solution
3.31 Rating (160 Votes )
There are 3 Steps involved in it
a Computing Scores using Linear Single Dimensional Value Functions To compute the scores for each candidate we first need to calculate the weighted sum for each candidates attributes using the given w... View full answer

Get step-by-step solutions from verified subject matter experts