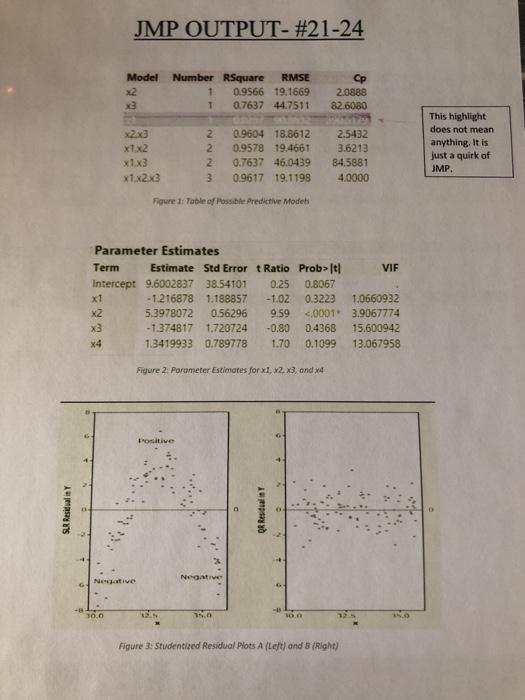
Question: please answer 21-24 thanks Question 21-24 Use the JMP output on page 7 to answer the following. 21. Which model is the best at predicting

please answer 21-24 thanks please answer 21-24 thanks Question 21-24 Use the
please answer 21-24 thanks Question 21-24 Use the
Question 21-24 Use the JMP output on page 7 to answer the following. 21. Which model is the best at predicting response, y? Justification: 22. Using the parameter estimates in the JMP output, is there a problem with multicollinearity? YES NO CANNOT ASSESS Justification: What other method(s) may be used to assess multicollinearity? 23. Examine Plots A and B in Figure 3. What could have happened to the data used to create Plot A to now produce Plot B? Assuming LR assumptions, which plot is the more desired residual plot? 24. Assuming an MLR model meets the required assumptions, sketch an appropriate histogram and normal probability plot of its residuals. JMP OUTPUT- #21-24 Model Number RSquare RMSE 1 0.9566 19.1669 1 0.7637 44.7511 2.0888 82.6060 x1.x2 x1x3 x1x2x3 2 2 Z 3 0.9604 18.8612 0.9578 19.4661 0.7637 46.0439 0.9617 19.1198 2.5432 3.6213 84.5881 4.0000 This highlight does not mean anything. It is just a quirk of JMP. Figure 1 Table of Possible Predictive Model Parameter Estimates Term Estimate Std Error t Ratio Prob> It! VIF Intercept 9.6002837 38.54101 0.25 0.8067 x1 -1216878 1.188857 -1.02 0.3222 1.0660932 X2 53978072 0.56296 9.59 0001 3.9067774 X3 -1.374817 1.720724 -0.80 0.4368 15.600942 x4 1.3419933 0.789778 1.70 0.1099 13.067958 Figure 2. Parameter Estimates for x1, x2x3, and 4 Five SUR Residualny QR Result Negative Negative 30.0 . Figure 3. Studentized Residual Pous A (Leftand 3 (Right) Question 21-24 Use the JMP output on page 7 to answer the following. 21. Which model is the best at predicting response, y? Justification: 22. Using the parameter estimates in the JMP output, is there a problem with multicollinearity? YES NO CANNOT ASSESS Justification: What other method(s) may be used to assess multicollinearity? 23. Examine Plots A and B in Figure 3. What could have happened to the data used to create Plot A to now produce Plot B? Assuming LR assumptions, which plot is the more desired residual plot? 24. Assuming an MLR model meets the required assumptions, sketch an appropriate histogram and normal probability plot of its residuals. JMP OUTPUT- #21-24 Model Number RSquare RMSE 1 0.9566 19.1669 1 0.7637 44.7511 2.0888 82.6060 x1.x2 x1x3 x1x2x3 2 2 Z 3 0.9604 18.8612 0.9578 19.4661 0.7637 46.0439 0.9617 19.1198 2.5432 3.6213 84.5881 4.0000 This highlight does not mean anything. It is just a quirk of JMP. Figure 1 Table of Possible Predictive Model Parameter Estimates Term Estimate Std Error t Ratio Prob> It! VIF Intercept 9.6002837 38.54101 0.25 0.8067 x1 -1216878 1.188857 -1.02 0.3222 1.0660932 X2 53978072 0.56296 9.59 0001 3.9067774 X3 -1.374817 1.720724 -0.80 0.4368 15.600942 x4 1.3419933 0.789778 1.70 0.1099 13.067958 Figure 2. Parameter Estimates for x1, x2x3, and 4 Five SUR Residualny QR Result Negative Negative 30.0 . Figure 3. Studentized Residual Pous A (Leftand 3 (Right)

Step by Step Solution

There are 3 Steps involved in it

1 Expert Approved Answer
Step: 1 Unlock blur-text-image
Question Has Been Solved by an Expert!

Get step-by-step solutions from verified subject matter experts

Step: 2 Unlock
Step: 3 Unlock

Students Have Also Explored These Related General Management Questions!