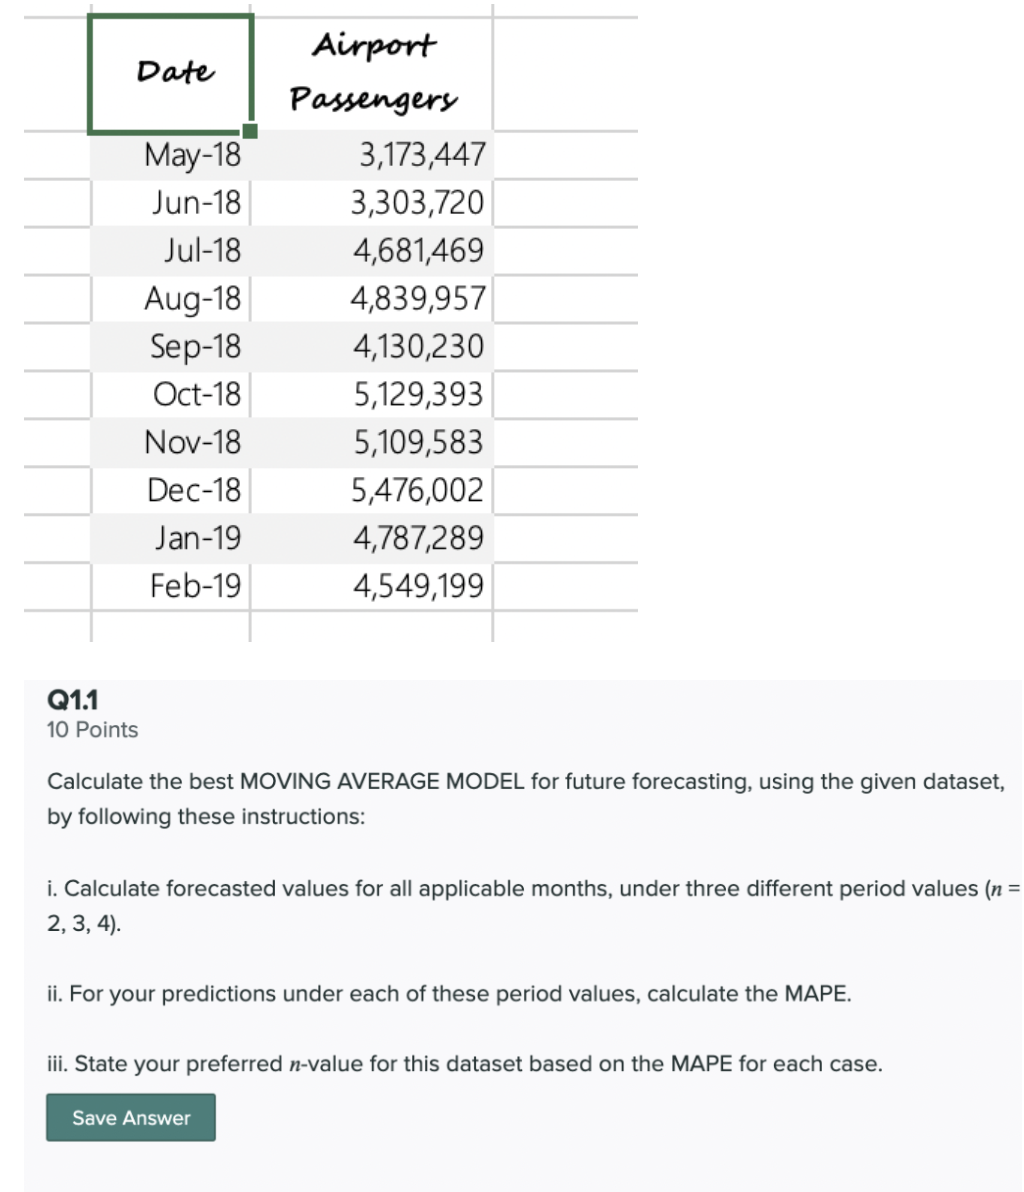
Question: . please answer 3 and 4 answer under questions for reference Date May-18 Jun-18 Jul-18 Aug-18 Sep-18 Oct-18 Nov-18 Dec-18 Jan-19 Feb-19 Airport Passengers 3,173,447

. please answer 3 and 4 answer under questions. please answer 3 and 4 answer under questions. please answer 3 and 4 answer under questions. please answer 3 and 4 answer under questions. please answer 3 and 4 answer under questions. please answer 3 and 4 answer under questions for reference

Date May-18 Jun-18 Jul-18 Aug-18 Sep-18 Oct-18 Nov-18 Dec-18 Jan-19 Feb-19 Airport Passengers 3,173,447 3,303,720 4,681,469 4,839,957 4,130,230 5,129,393 5,109,583 5,476,002 4,787,289 4,549,199 Q1.1 10 Points Calculate the best MOVING AVERAGE MODEL for future forecasting, using the given dataset, by following these instructions: i. Calculate forecasted values for all applicable months, under three different period values (n = 2, 3, 4). ii. For your predictions under each of these period values, calculate the MAPE. iii. State your preferred n-value for this dataset based on the MAPE for each case. Save Answer Q1.2 10 Points Calculate the best EXPONENTIAL SMOOTHING MODEL for future forecasting, using the given dataset, by following these instructions: i. Calculate forecasted values for all applicable months, under three different smoothing coefficients (a = 0.2, 0.5, 0.8). Assume that the forecasted value for May-2018 is 3,250,000. ii. For your predictions under each of these smoothing coefficients (a values), calculate the MAPE. iii. State your preferred a value for this dataset based on the MAPE for each case. Q1.3 5 Points Briefly explain 3 additional qualitative' factors you will account for, if you were a forecast analyst at the Nashville Airport (Note: Full credit will be awarded only if your answers are practical and realistic) Save Answer Q1.4 3 Points List 3 operational decisions that would be taken at an airport, based on forecasts like these. Save Answer (1) (MA-n)= Sum of data of n period (2) Exponential smoothing forecast F(t+1) = At*a + (1-2) Ft F(t+1) = Forecast for the period (t+1) At = Actual demand for the period t a =Exponential constant Ft = Forecast for the period t = Initial forecast N=6 SUM 0.671 0.574 0.572 MAPE 11.18 9.57 9.54 MAPE = [SUM{ABS(A-F)/A}/N]*100 Lower is the MAPE, better is the forecast. Therefore 4-period moving average is a better forecasting technique

Step by Step Solution

There are 3 Steps involved in it

1 Expert Approved Answer
Step: 1 Unlock blur-text-image
Question Has Been Solved by an Expert!

Get step-by-step solutions from verified subject matter experts

Step: 2 Unlock
Step: 3 Unlock

Students Have Also Explored These Related General Management Questions!