

Question: please answer 3-5. CHAPTER 3 Financial Statements Analysis and Financial Models 83 EAST COAST YACHTS 2019 Income Statement $231.900,000 Sales Cost of goods sold 170,157,000
please answer 3-5.
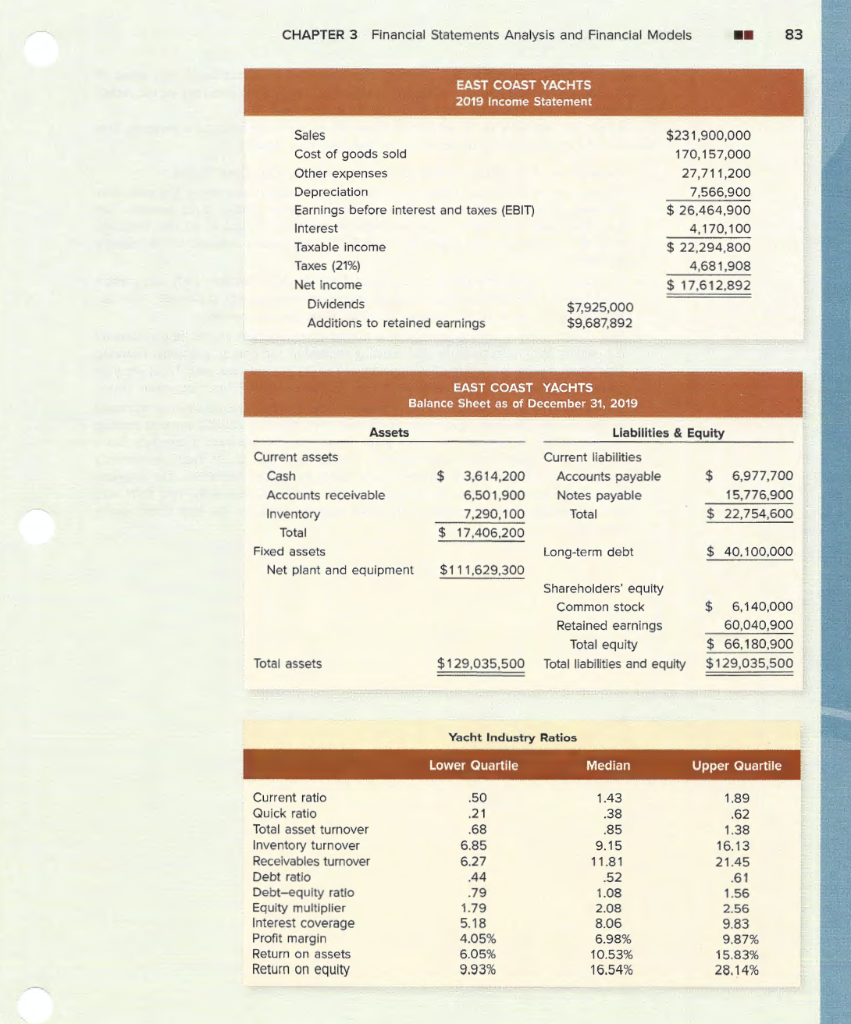
CHAPTER 3 Financial Statements Analysis and Financial Models 83 EAST COAST YACHTS 2019 Income Statement $231.900,000 Sales Cost of goods sold 170,157,000 27,711,200 Other expenses Depreciation 7,566,900 $26,464,900 Earnings before interest and taxes (EBIT) Interest 4,170,100 $ 22,294,800 Taxable income Taxes (21%) 4,681,908 $ 17,612,892 Net Income Dividends $7,925,000 $9,687,892 Additions to retained earnings EAST COAST YACHTS Balance Sheet as of December 31, 2019 Liabilities & Equity Assets Current assets Current liabilities $ 3,614,200 Accounts payable Notes payable 6,977,700 Cash Accounts receivable 6,501,900 15,776,900 22,754,600 Inventory 7,290,100 Total $17,406,200 Total Fixed assets Long-term debt 40,100,000 Net plant and equipment $111,629,300 Shareholders' equity Common stock 6,140,000 Retained earnings 60,040,900 $66,180,900 Total equity $129,035,500 $129,035,500 Total assets Total liabilities and equity Yacht Industry Ratios Lower Quartile Median Upper Quartile Current ratio 50 1.43 1,89 Quick ratio Total asset turnover 21 38 62 1,38 16.13 68 85 Inventory turnover vables turnover Debt ratio 6.85 9.15 11.81 5.2 21.45 .61 cer 44 52 Debt-equity ratio Equity multiplier Interest coverage Profit margin 79 1.08 1.56 1.79 5.18 4.05% 2.08 2.56 8.06 9.83 6.98% 10.53% 16.54% 9.87% Return on assets Return on equity 6.05% 15.83% 9.93% 28.14% 84 PART I Overview ensures that attention to detail is a necessity. For example, East Coast Yachts will spend 80 to 100 hours on hand-buffing the stainless steel stem-iron, which is the metal cap on the yacht's bow that conceivably could collide with a dock or another boat. To get Dan started with his analyses, Larissa has provided the financial statements. Dan has gathered the industry ratios for the yacht manufacturing industry. 1. Calculate all of the ratios listed in the industry table for East Coast Yachts 2. Compare the performance of East Coast Yachts to the industry as a whole. For each ratio, comment on why it might be viewed as positive or negative relative to the industry. Sup- pose you create an inventory ratio calculated as inventory divided by current liabilities How do you interpret this ratio? How does East Coast Yachts compare to the industry average? 3. Calculate the sustainable growth rate of East Coast Yachts. Calculate EFN and prepare pro forma income statements and balance sheets assuming growth at precisely this rate. Recalculate the ratios in the previous question. What do you observe? 4. East Coast Yachts is unlikely to be willing to raise external equity capital, in part because the owners don't want to dilute their existing ownership and control positions. However, East Coast Yachts is planning for a growth rate of 20 percent next year. What are your conclusions and recommendations about the feasibility of East Coast's expansion plans? 5. Most assets can be increased as a percentage of sales. For example, cash can be increased by any amount. However, fixed assets often must be increased in specific amounts because it is impossible to buy part of a new plant or machine. In this case, a company has a "staircase" or "lumpy" fixed cost structure. Assume that East Coast Yachts is currently producing at 100 percent of capacity. As a result, to expand production, the company must set up an entirely new line at a cost of $30 million. Calculate the new EFN with this assumption. What does this imply about capacity utilization for East Coast Yachts next year? CHAPTER 3 Financial Statements Analysis and Financial Models 83 EAST COAST YACHTS 2019 Income Statement $231.900,000 Sales Cost of goods sold 170,157,000 27,711,200 Other expenses Depreciation 7,566,900 $26,464,900 Earnings before interest and taxes (EBIT) Interest 4,170,100 $ 22,294,800 Taxable income Taxes (21%) 4,681,908 $ 17,612,892 Net Income Dividends $7,925,000 $9,687,892 Additions to retained earnings EAST COAST YACHTS Balance Sheet as of December 31, 2019 Liabilities & Equity Assets Current assets Current liabilities $ 3,614,200 Accounts payable Notes payable 6,977,700 Cash Accounts receivable 6,501,900 15,776,900 22,754,600 Inventory 7,290,100 Total $17,406,200 Total Fixed assets Long-term debt 40,100,000 Net plant and equipment $111,629,300 Shareholders' equity Common stock 6,140,000 Retained earnings 60,040,900 $66,180,900 Total equity $129,035,500 $129,035,500 Total assets Total liabilities and equity Yacht Industry Ratios Lower Quartile Median Upper Quartile Current ratio 50 1.43 1,89 Quick ratio Total asset turnover 21 38 62 1,38 16.13 68 85 Inventory turnover vables turnover Debt ratio 6.85 9.15 11.81 5.2 21.45 .61 cer 44 52 Debt-equity ratio Equity multiplier Interest coverage Profit margin 79 1.08 1.56 1.79 5.18 4.05% 2.08 2.56 8.06 9.83 6.98% 10.53% 16.54% 9.87% Return on assets Return on equity 6.05% 15.83% 9.93% 28.14% 84 PART I Overview ensures that attention to detail is a necessity. For example, East Coast Yachts will spend 80 to 100 hours on hand-buffing the stainless steel stem-iron, which is the metal cap on the yacht's bow that conceivably could collide with a dock or another boat. To get Dan started with his analyses, Larissa has provided the financial statements. Dan has gathered the industry ratios for the yacht manufacturing industry. 1. Calculate all of the ratios listed in the industry table for East Coast Yachts 2. Compare the performance of East Coast Yachts to the industry as a whole. For each ratio, comment on why it might be viewed as positive or negative relative to the industry. Sup- pose you create an inventory ratio calculated as inventory divided by current liabilities How do you interpret this ratio? How does East Coast Yachts compare to the industry average? 3. Calculate the sustainable growth rate of East Coast Yachts. Calculate EFN and prepare pro forma income statements and balance sheets assuming growth at precisely this rate. Recalculate the ratios in the previous question. What do you observe? 4. East Coast Yachts is unlikely to be willing to raise external equity capital, in part because the owners don't want to dilute their existing ownership and control positions. However, East Coast Yachts is planning for a growth rate of 20 percent next year. What are your conclusions and recommendations about the feasibility of East Coast's expansion plans? 5. Most assets can be increased as a percentage of sales. For example, cash can be increased by any amount. However, fixed assets often must be increased in specific amounts because it is impossible to buy part of a new plant or machine. In this case, a company has a "staircase" or "lumpy" fixed cost structure. Assume that East Coast Yachts is currently producing at 100 percent of capacity. As a result, to expand production, the company must set up an entirely new line at a cost of $30 million. Calculate the new EFN with this assumption. What does this imply about capacity utilization for East Coast Yachts next year
Step by Step Solution
There are 3 Steps involved in it

Get step-by-step solutions from verified subject matter experts