Question: Please answer 3-8 I do not need 1-2 CAPACITY AND BOTTLENECK ANALYSIS REMINDER: BEFORE THE EXAM ENDS, YOU MUST TAKE A PICTURE OF YOUR SOLUTIONS
 Please answer 3-8 I do not need 1-2
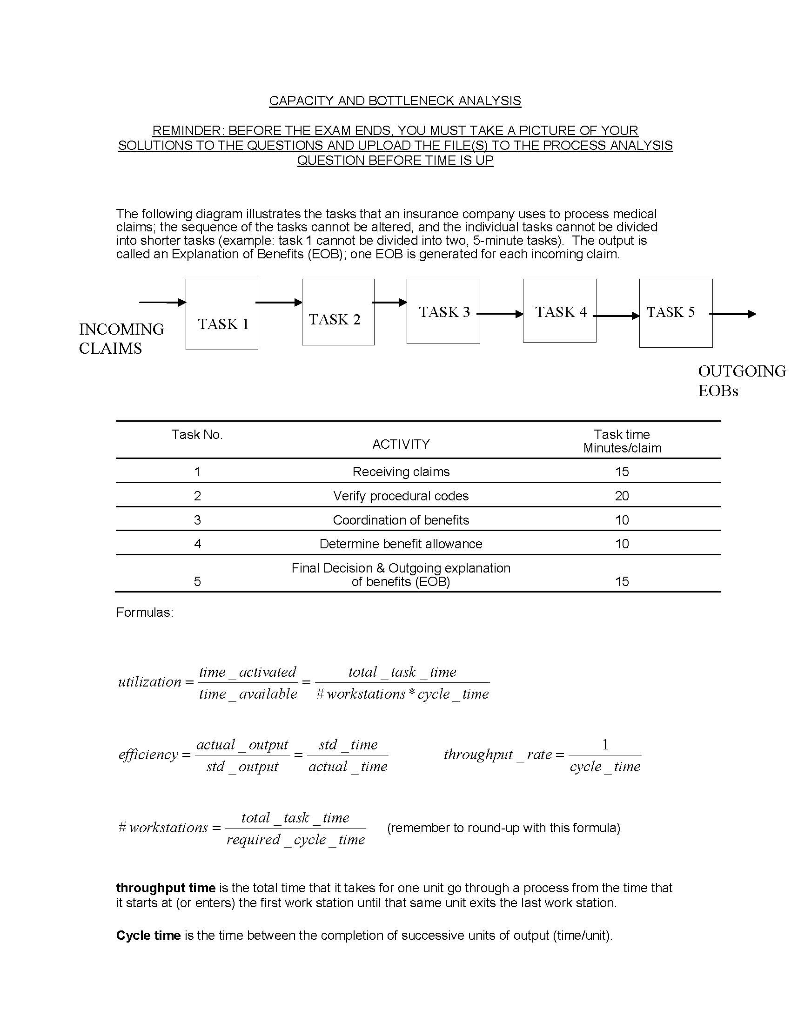
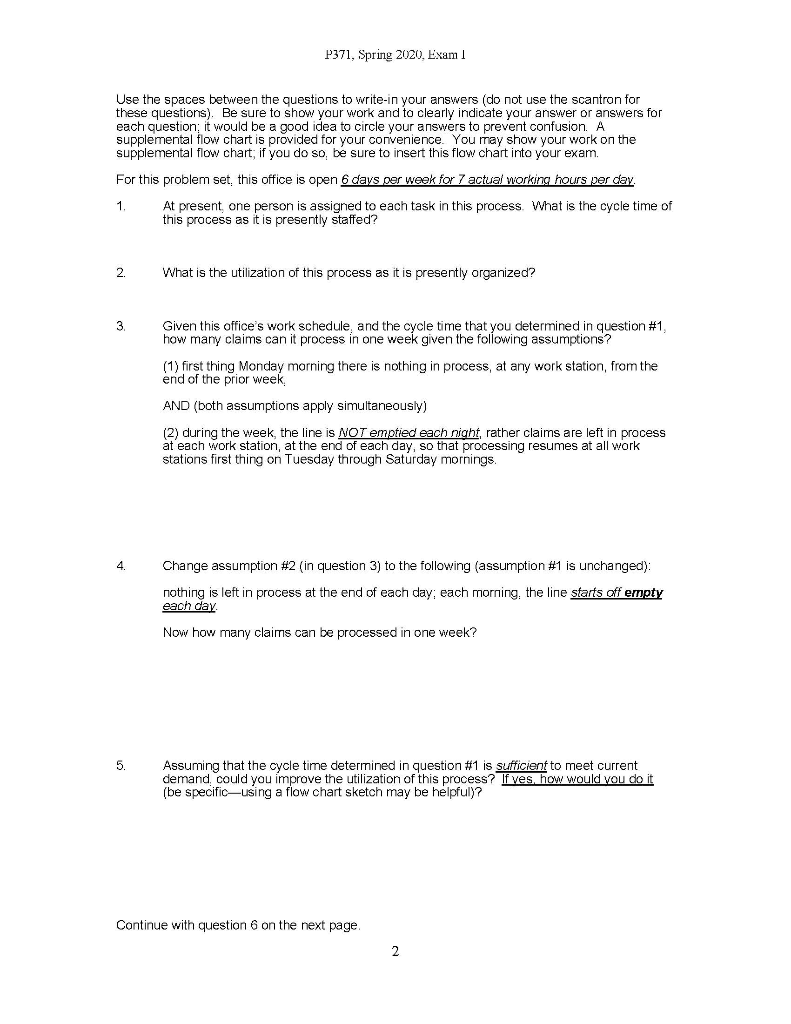
CAPACITY AND BOTTLENECK ANALYSIS REMINDER: BEFORE THE EXAM ENDS, YOU MUST TAKE A PICTURE OF YOUR SOLUTIONS TO THE QUESTIONS AND UPLOAD THE FILE(S) TO THE PROCESS ANALYSIS QUESTION BEFORE TIME IS UP The following diagram illustrates the tasks that an insurance company uses to process medical claims; the sequence of the tasks cannot be altered, and the individual tasks cannot be divided into shorter tasks (example: task 1 cannot be divided into two, 5-minute tasks). The output is called an Explanation of Benefits (EOB), one EOB is generated for each incoming claim TASK 2 TASK 3 TASK 4 TASK 5 TASK 1 INCOMING CLAIMS OUTGOING EOBS Task No ACTIVITY Task time Minutes/claim 1 15 2 Receiving claims Verify procedural codes Coordination of benefits 20 3 10 4 Determine benefit allowance 10 Final Decision & Outgoing explanation of benefits (EOB) 5 15 Formulas: lime_uctivaled total lasklime utilization = time_available 4 workstations * cycle_time efficiency= actual_output std_output std_time actual_time 1 throughnut_rate= cycle_time total_task_time #workstations = required_cycle_time (remember to round-up with this formula) throughput time is the total time that it takes for one unit go through a process from the time that it starts at (or enters) the first work station until that same unit exits the last work station. Cycle time is the time between the completion of successive units of output (time/unit). P371, Spring 2020, Exam I Use the spaces between the questions to write-in your answers (do not use the scantron for these questions). Be sure to show your work and to clearly indicate your answer or answers for each question; it would be a good idea to circle your answers to prevent confusion. A supplemental flow chart is provided for your convenience. You may show your work on the supplemental flow chart; if you do so, be sure to insert this flow chart into your exam. For this problem set. this office is open 6 days per week for 7 actual working hours per day. 1. At present, one person is assigned to each task in this process. What is the cycle time of this process as it is presently staffed? 2 What is the utilization of this process as it is presently organized? 3 Given this office's work schedule and the cycle time that you determined in question #1, how many claims can it process in one week given the following assumptions? (1) first thing Monday morning there is nothing in process, at any work station, from the end of the prior week AND (both assumptions apply simultaneously) (2) during the week the line is NOT emptied each night, rather claims are left in process at each work station, at the end of each day, so that processing resumes at all work stations first thing on Tuesday through Saturday mornings. Change assumption #2 (in question 3) to the following (assumption #1 is unchanged): nothing is left in process at the end of each day; each morning, the line starts off empty each day Now how many claims can be processed in one week? Assuming that the cycle time determined in question #1 is sufficient to meet current demand could you improve the utilization of this process? If yes, how would you do it (be specificusing a flow chart sketch may be helpful)? Continue with question 6 on the next page 2 P371, Spring 2020, Exam 6. Continuing from question 5, if you answered "yes", what would be the new utilization? (if you answered "no", leave this question blank.) 7 Suppose that the demand drops and the throughput rate needs to be cut in half. What cycle time would now be required? 8 Continuing from question 7 how would you combine these tasks into how many work stations to try to match the new required cycle time? Any combination must keep the tasks in sequence, and the existing tasks cannot be divided into smaller tasks. (HINT: The total task time that you determine for any one work station cannot exceed your answer to question 7; however, it can be less.) 3 CAPACITY AND BOTTLENECK ANALYSIS REMINDER: BEFORE THE EXAM ENDS, YOU MUST TAKE A PICTURE OF YOUR SOLUTIONS TO THE QUESTIONS AND UPLOAD THE FILE(S) TO THE PROCESS ANALYSIS QUESTION BEFORE TIME IS UP The following diagram illustrates the tasks that an insurance company uses to process medical claims; the sequence of the tasks cannot be altered, and the individual tasks cannot be divided into shorter tasks (example: task 1 cannot be divided into two, 5-minute tasks). The output is called an Explanation of Benefits (EOB), one EOB is generated for each incoming claim TASK 2 TASK 3 TASK 4 TASK 5 TASK 1 INCOMING CLAIMS OUTGOING EOBS Task No ACTIVITY Task time Minutes/claim 1 15 2 Receiving claims Verify procedural codes Coordination of benefits 20 3 10 4 Determine benefit allowance 10 Final Decision & Outgoing explanation of benefits (EOB) 5 15 Formulas: lime_uctivaled total lasklime utilization = time_available 4 workstations * cycle_time efficiency= actual_output std_output std_time actual_time 1 throughnut_rate= cycle_time total_task_time #workstations = required_cycle_time (remember to round-up with this formula) throughput time is the total time that it takes for one unit go through a process from the time that it starts at (or enters) the first work station until that same unit exits the last work station. Cycle time is the time between the completion of successive units of output (time/unit). P371, Spring 2020, Exam I Use the spaces between the questions to write-in your answers (do not use the scantron for these questions). Be sure to show your work and to clearly indicate your answer or answers for each question; it would be a good idea to circle your answers to prevent confusion. A supplemental flow chart is provided for your convenience. You may show your work on the supplemental flow chart; if you do so, be sure to insert this flow chart into your exam. For this problem set. this office is open 6 days per week for 7 actual working hours per day. 1. At present, one person is assigned to each task in this process. What is the cycle time of this process as it is presently staffed? 2 What is the utilization of this process as it is presently organized? 3 Given this office's work schedule and the cycle time that you determined in question #1, how many claims can it process in one week given the following assumptions? (1) first thing Monday morning there is nothing in process, at any work station, from the end of the prior week AND (both assumptions apply simultaneously) (2) during the week the line is NOT emptied each night, rather claims are left in process at each work station, at the end of each day, so that processing resumes at all work stations first thing on Tuesday through Saturday mornings. Change assumption #2 (in question 3) to the following (assumption #1 is unchanged): nothing is left in process at the end of each day; each morning, the line starts off empty each day Now how many claims can be processed in one week? Assuming that the cycle time determined in question #1 is sufficient to meet current demand could you improve the utilization of this process? If yes, how would you do it (be specificusing a flow chart sketch may be helpful)? Continue with question 6 on the next page 2 P371, Spring 2020, Exam 6. Continuing from question 5, if you answered "yes", what would be the new utilization? (if you answered "no", leave this question blank.) 7 Suppose that the demand drops and the throughput rate needs to be cut in half. What cycle time would now be required? 8 Continuing from question 7 how would you combine these tasks into how many work stations to try to match the new required cycle time? Any combination must keep the tasks in sequence, and the existing tasks cannot be divided into smaller tasks. (HINT: The total task time that you determine for any one work station cannot exceed your answer to question 7; however, it can be less.) 3


