

Question: please answer 3d and 4d Post-SOXYears20032017 Complete this question by entering your answers in the tabs below. Using the fiter options in the upper right
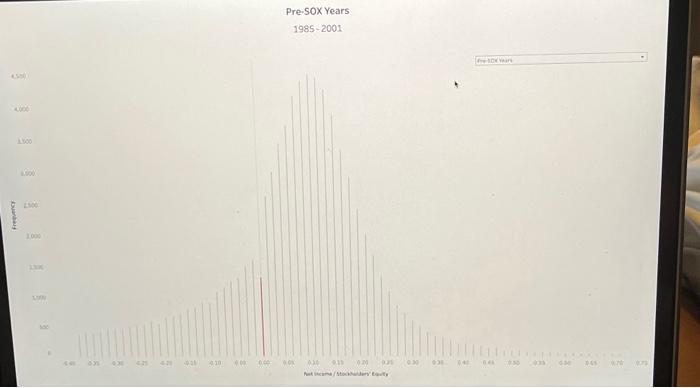
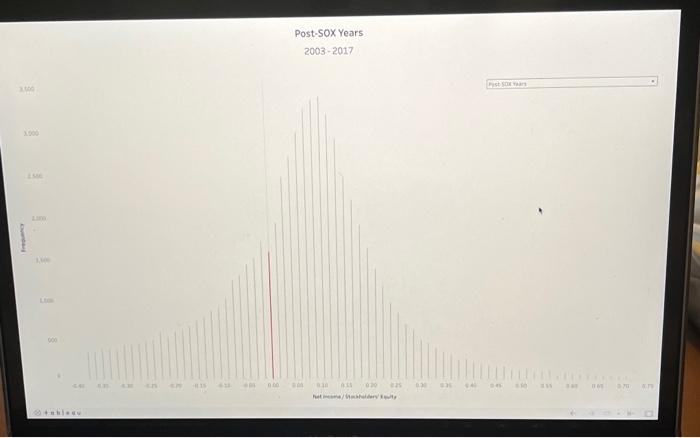
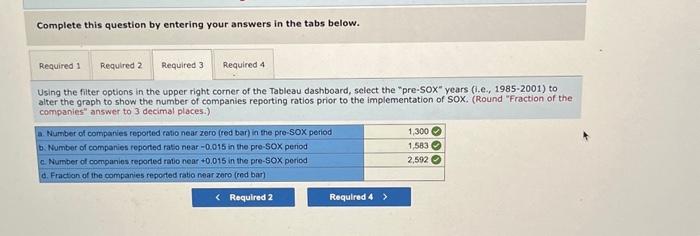
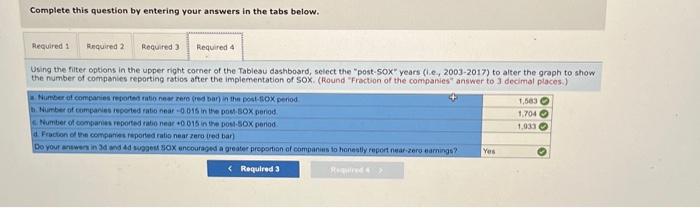
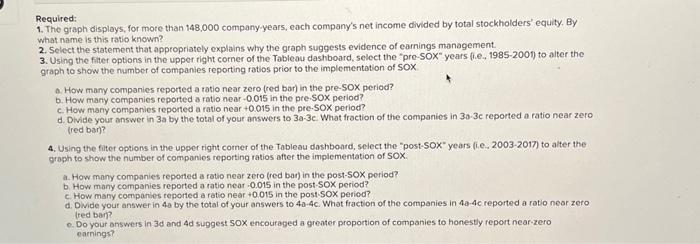
Post-SOXYears20032017 Complete this question by entering your answers in the tabs below. Using the fiter options in the upper right corner of the Tableau dashboard, select the "pre-SOX" years (1.e., 1985-2001) to alter the graph to show the number of companies reporting ratios prior to the implementation of SOX. (Round "Fraction of the companies" answer to 3 decimal places.) Complete this question by entering your answers in the tabs below. Using the fiter options in the upper right comer of the Tablesu dashbosrd; select the "post-50X" years (i.e, 2003-2017) to alter the graph to show the number of companies reporting ratios after the implementation of Sox. (Round "Fraction of the companies" answer to 3 decimal places.) Pre-SOX Years 1985-2001 Required: 1. The graph displays, for more than 148,000 company-years, each company's net income divided by total stockholders' equity. By what name is this ratio known? 2. Select the statement that appropriately explains why the graph suggests evidence of earnings management. 3. Using the fiter options in the upper right corner of the Tableau dashboard, select the "pre-SOX" years (0.e., 1985-2001) to alter the graph to show the number of companies reporting ratios prior to the implementation of SOX a. How many companies reported a ratio near zero (red bar) in the pre-SOX period? b. How many companies reported a ratio near-0.015 in the pre-sOX period? c. How many companies reported a ratio near +0.015 in the pre-SOX period? d. Divide your answer in 3 a by the total of your answers to 3a3c. What fraction of the companios in 30.3c reported a ratio near zero (red bar)? 4. Using the fiter options in the upper right comer of the Tableau dashboard, select the "post-SOX" years (i.e-. 2003-2017) to alter the groph to show the number of componies reporting ratios after the implementation of 50X. a. How many companies reported a ratio near zero (red bar) in the post-SOX poriod? b. How many companies reported a ratio near -0.015 in the post-SOX period? c. How many companies teported a ratio near +0.015 in the post-SOX period? d. Dwide yout answer in 4a by the total of your answers to 404c. What fraction of the companies in 4a4c reported a ratio near zero (red bar)? e. Do your answers in 3d and 4d suggest SOX encouraged a greater proportion of companies to honestly report near-zero earnings? Post-SOXYears20032017 Complete this question by entering your answers in the tabs below. Using the fiter options in the upper right corner of the Tableau dashboard, select the "pre-SOX" years (1.e., 1985-2001) to alter the graph to show the number of companies reporting ratios prior to the implementation of SOX. (Round "Fraction of the companies" answer to 3 decimal places.) Complete this question by entering your answers in the tabs below. Using the fiter options in the upper right comer of the Tablesu dashbosrd; select the "post-50X" years (i.e, 2003-2017) to alter the graph to show the number of companies reporting ratios after the implementation of Sox. (Round "Fraction of the companies" answer to 3 decimal places.) Pre-SOX Years 1985-2001 Required: 1. The graph displays, for more than 148,000 company-years, each company's net income divided by total stockholders' equity. By what name is this ratio known? 2. Select the statement that appropriately explains why the graph suggests evidence of earnings management. 3. Using the fiter options in the upper right corner of the Tableau dashboard, select the "pre-SOX" years (0.e., 1985-2001) to alter the graph to show the number of companies reporting ratios prior to the implementation of SOX a. How many companies reported a ratio near zero (red bar) in the pre-SOX period? b. How many companies reported a ratio near-0.015 in the pre-sOX period? c. How many companies reported a ratio near +0.015 in the pre-SOX period? d. Divide your answer in 3 a by the total of your answers to 3a3c. What fraction of the companios in 30.3c reported a ratio near zero (red bar)? 4. Using the fiter options in the upper right comer of the Tableau dashboard, select the "post-SOX" years (i.e-. 2003-2017) to alter the groph to show the number of componies reporting ratios after the implementation of 50X. a. How many companies reported a ratio near zero (red bar) in the post-SOX poriod? b. How many companies reported a ratio near -0.015 in the post-SOX period? c. How many companies teported a ratio near +0.015 in the post-SOX period? d. Dwide yout answer in 4a by the total of your answers to 404c. What fraction of the companies in 4a4c reported a ratio near zero (red bar)? e. Do your answers in 3d and 4d suggest SOX encouraged a greater proportion of companies to honestly report near-zero earnings
Step by Step Solution
There are 3 Steps involved in it

Get step-by-step solutions from verified subject matter experts