

Question: Please answer 5. The following table gives mortality statistics for a fictitious county in a rural state for a period of July 1st to June
Please answer
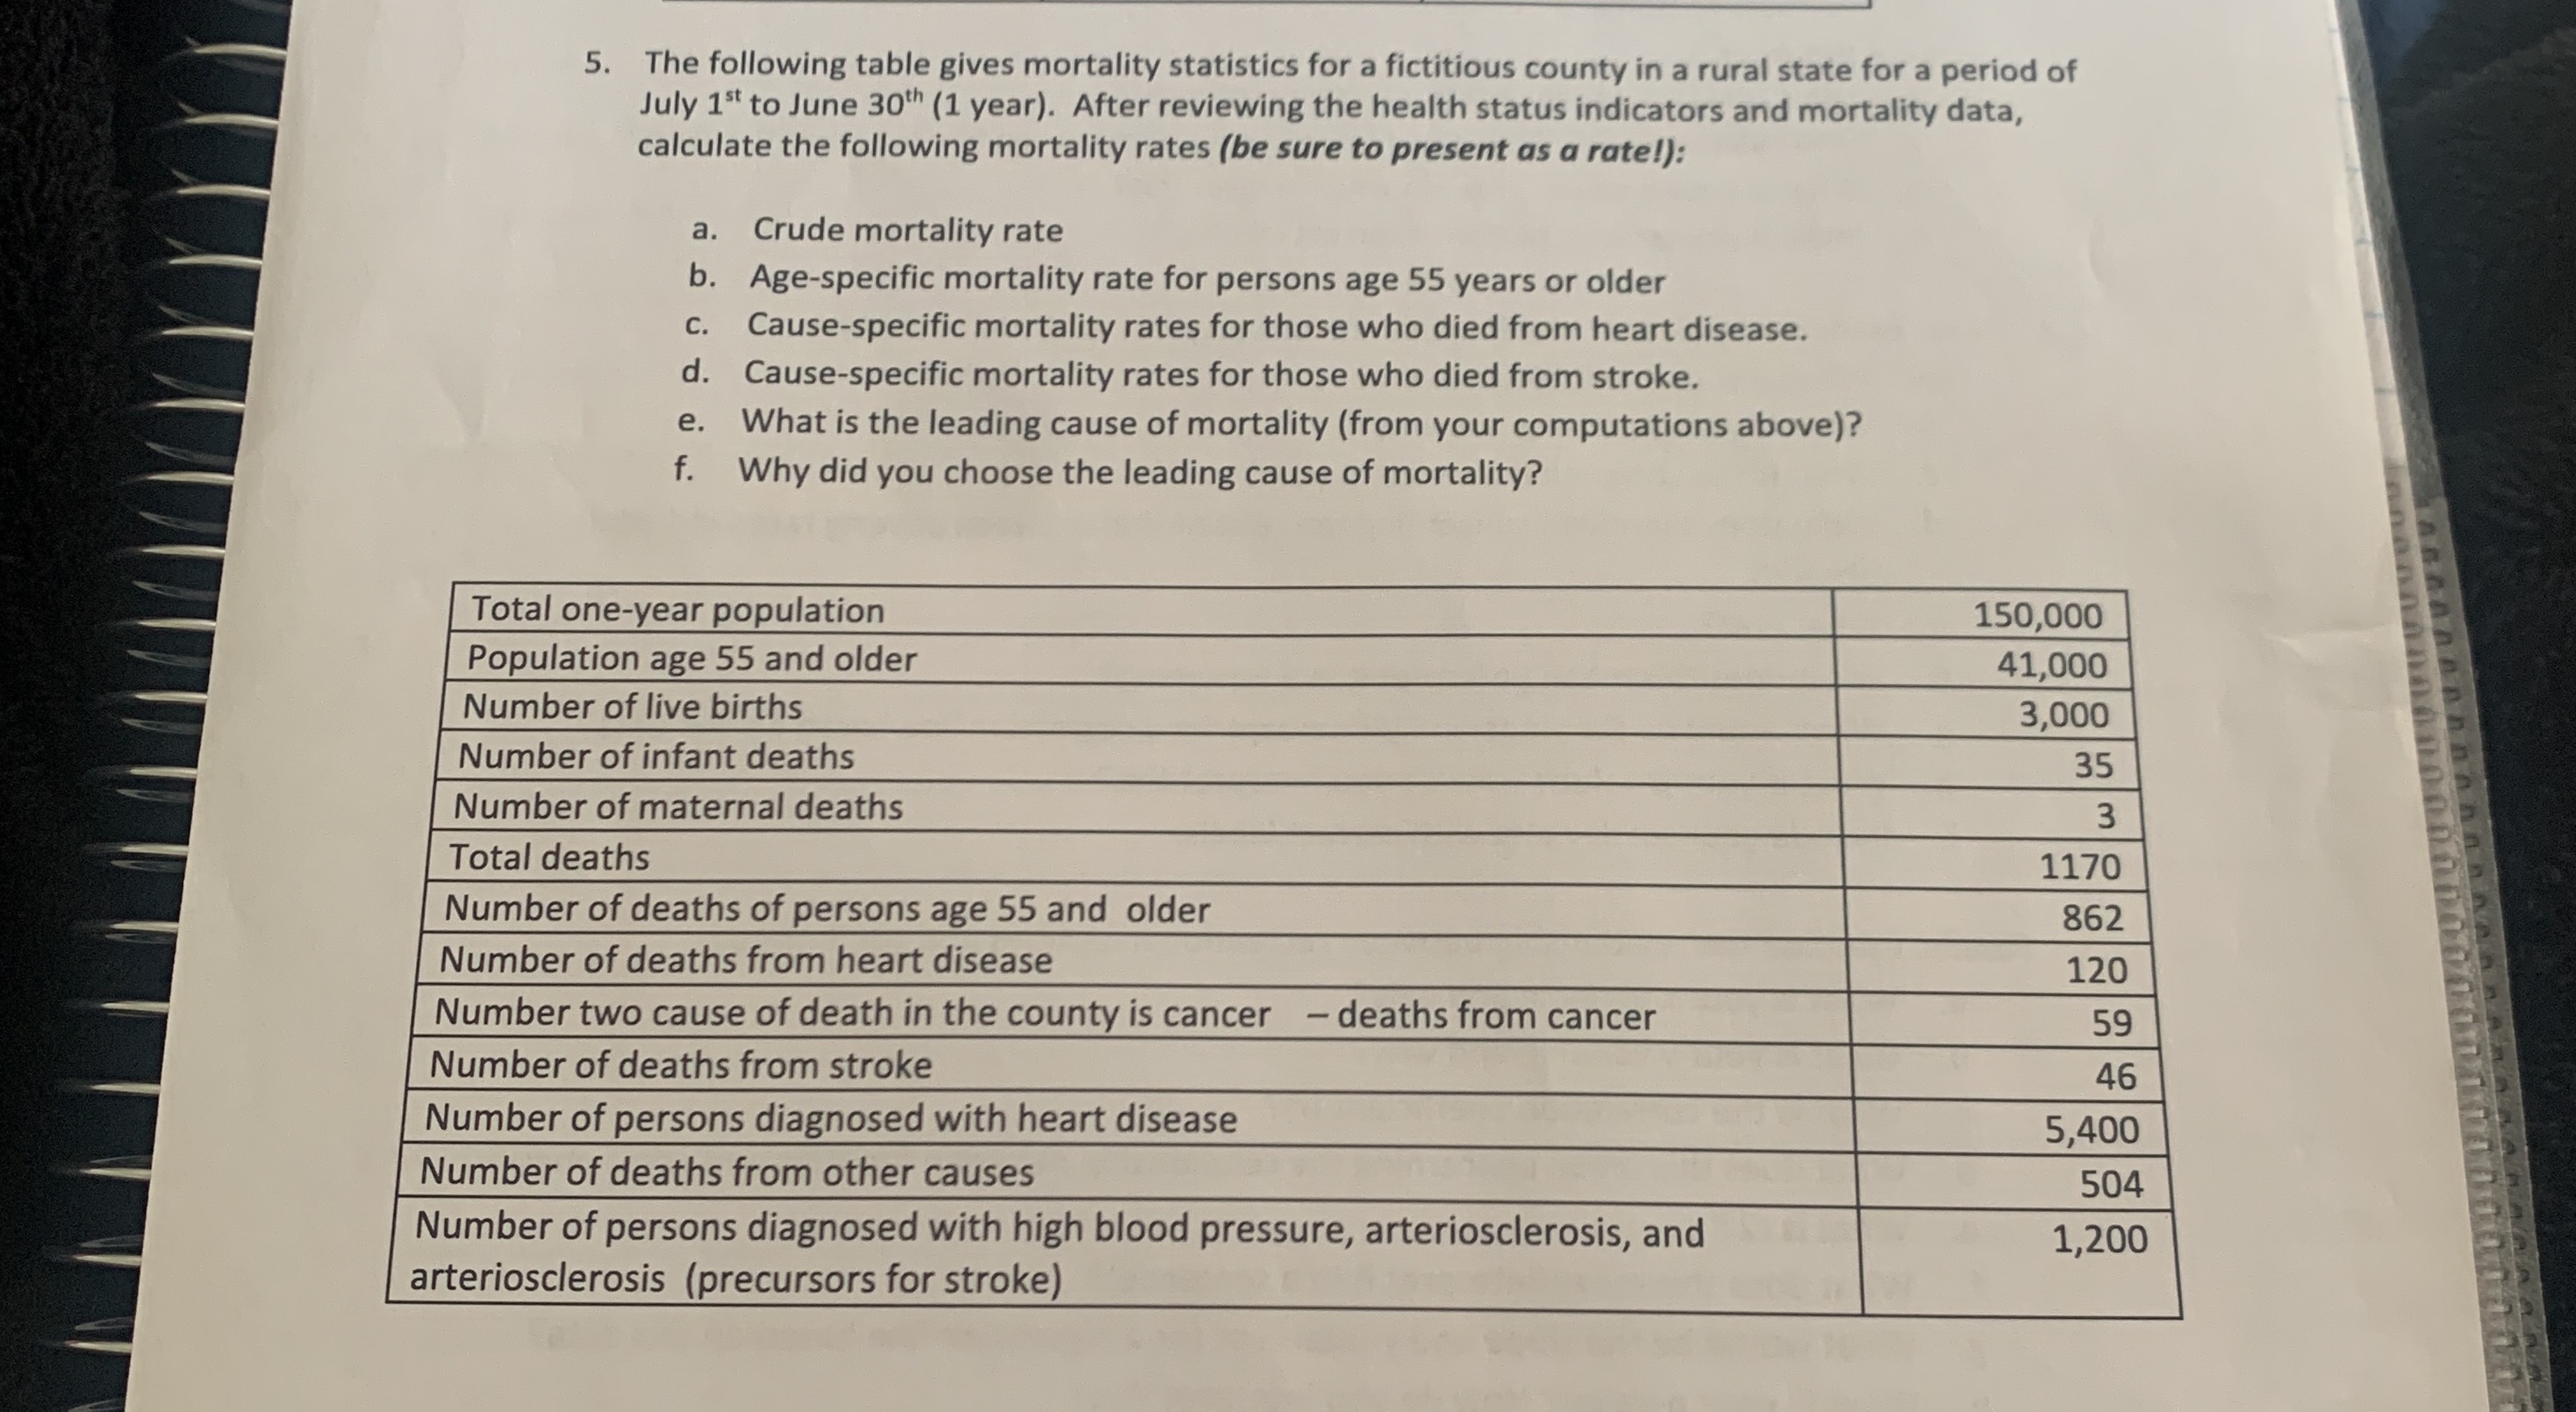
5. The following table gives mortality statistics for a fictitious county in a rural state for a period of July 1st to June 30th (1 year). After reviewing the health status indicators and mortality data, calculate the following mortality rates (be sure to present as a rate!): a. Crude mortality rate b. Age-specific mortality rate for persons age 55 years or older c. Cause-specific mortality rates for those who died from heart disease. d. Cause-specific mortality rates for those who died from stroke. e. What is the leading cause of mortality (from your computations above)? f. Why did you choose the leading cause of mortality? Total one-year population 150,000 Population age 55 and older 41,000 Number of live births 3,000 Number of infant deaths 35 Number of maternal deaths 3 Total deaths 1170 Number of deaths of persons age 55 and older 862 Number of deaths from heart disease 120 Number two cause of death in the county is cancer - deaths from cancer 59 Number of deaths from stroke 46 Number of persons diagnosed with heart disease 5,400 Number of deaths from other causes 504 Number of persons diagnosed with high blood pressure, arteriosclerosis, and 1,200 arteriosclerosis (precursors for stroke)
Step by Step Solution
There are 3 Steps involved in it

Get step-by-step solutions from verified subject matter experts