

Question: Please answer 6-10 questions. I have attached the histogram page Independent Lab Assessment Questions For questions 6 through 10, use the following information to answer
 Please answer 6-10 questions. I have attached the histogram page
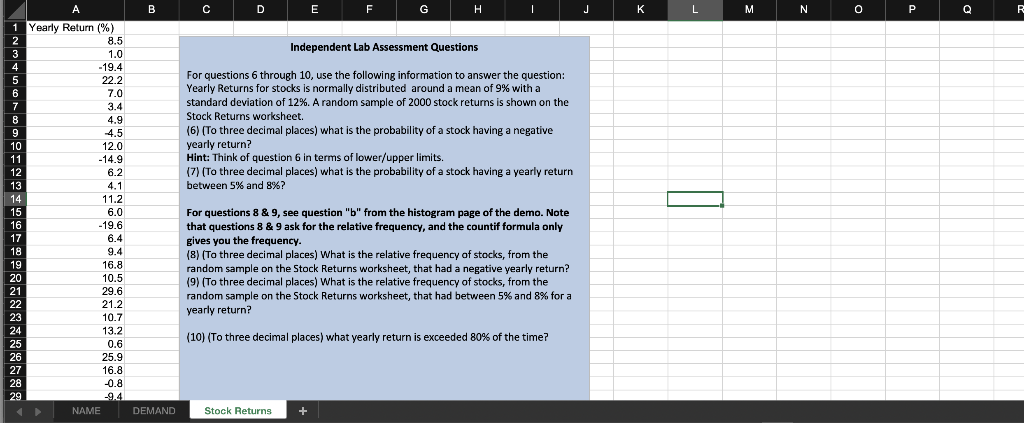
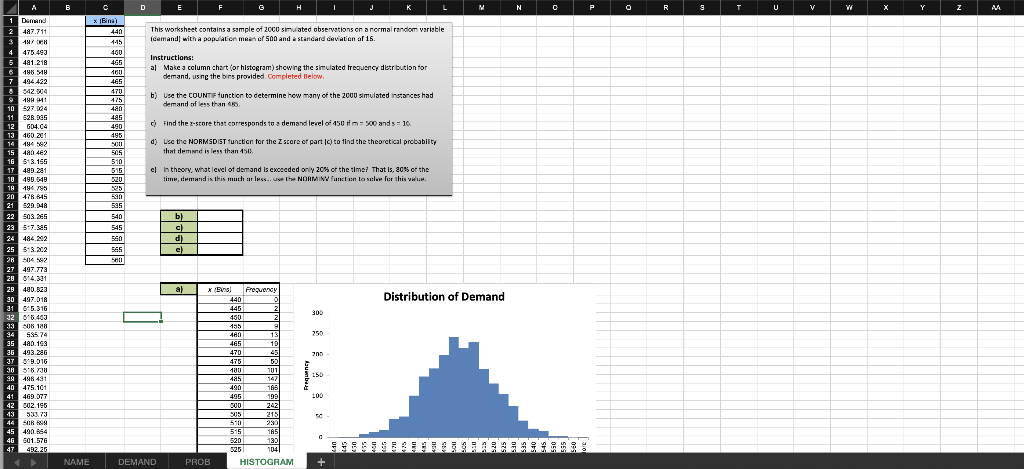
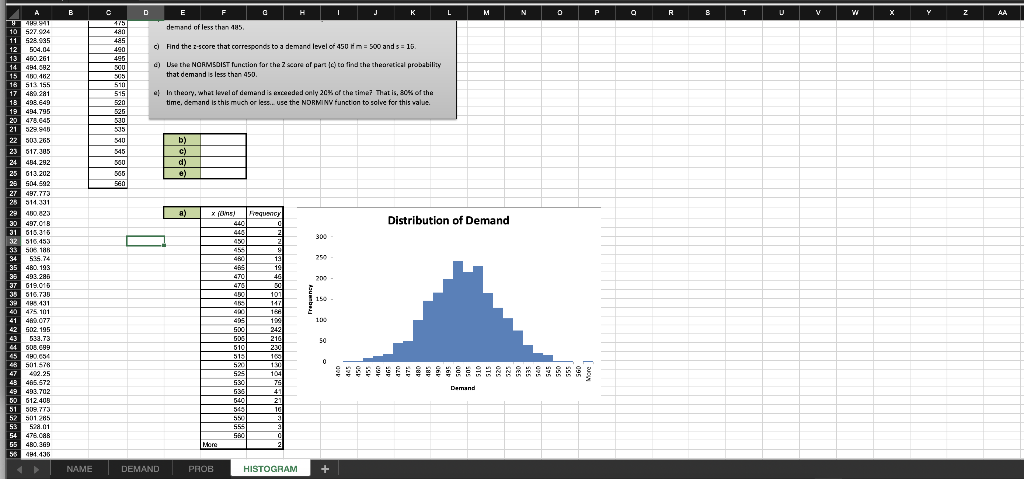
Independent Lab Assessment Questions For questions 6 through 10, use the following information to answer the question: Yearly Returns for stocks is normally distributed around a mean of 9% with a standard deviation of 12%. A random sample of 2000 stock returns is shown on the Stock Returns worksheet. (6) (To three decimal places) what is the probability of a stock having a negative yearly return? Hint: Think of question 6 in terms of lower/upper limits. (7) (To three decimal places) what is the probability of a stock having a yearly return between 5% and 8% ? For questions 8& 9, see question "b" from the histogram page of the demo. Note that questions 8 \& 9 ask for the relative frequency, and the countif formula only gives you the frequency. (8) (To three decimal places) What is the relative frequency of stocks, from the random sample on the Stock Returns worksheet, that had a negative yearly return? (9) (To three decimal places) What is the relative frequency of stocks, from the random sample on the Stock Returns worksheet, that had between 5% and 8% for a yearly return? (10) (To three decimal places) what yearly return is exceeded 80% of the time? This workshset contains a sample of 2000 simu ated observetions en a normal random varistle fcemand) with a popuatich mazi of 500 and a stardard cevation al 15. Instructions: a) Make a column chart (or histogram) shcwing the simulated frequancf dlatr bution tor demand, us ng the bers prowided. Completed Below b) Use the couvmiF function to determine how many of the 2000 simulated inctsces had demand of less than 65 . c) Find the r-store that corresponds to a demand level oi 450ifm=500 and s=10 d) Lse the NORMSDIET tunzticn for the I scere of part |ci to find the thearetical probabilt, that demend is less than 450 . e) In theory. What level of dermand is ewoecded ooly 20 or the time? That 15 , a0s of the c) Find the z-score that correxponds to a demand level of 450Hm=500 and s=15. d) Lae the NOfmbOIST functian far the 2 scare af part |ci ta fivd tha thearetical probability that demand is less then 450. ef In theary, what lounl of demand is encended only 20% of then tima? That is, sof of the time, demsnd is this much or lege. Use the NDRMINV funct on to solve for this walue. Independent Lab Assessment Questions For questions 6 through 10, use the following information to answer the question: Yearly Returns for stocks is normally distributed around a mean of 9% with a standard deviation of 12%. A random sample of 2000 stock returns is shown on the Stock Returns worksheet. (6) (To three decimal places) what is the probability of a stock having a negative yearly return? Hint: Think of question 6 in terms of lower/upper limits. (7) (To three decimal places) what is the probability of a stock having a yearly return between 5% and 8% ? For questions 8& 9, see question "b" from the histogram page of the demo. Note that questions 8 \& 9 ask for the relative frequency, and the countif formula only gives you the frequency. (8) (To three decimal places) What is the relative frequency of stocks, from the random sample on the Stock Returns worksheet, that had a negative yearly return? (9) (To three decimal places) What is the relative frequency of stocks, from the random sample on the Stock Returns worksheet, that had between 5% and 8% for a yearly return? (10) (To three decimal places) what yearly return is exceeded 80% of the time? This workshset contains a sample of 2000 simu ated observetions en a normal random varistle fcemand) with a popuatich mazi of 500 and a stardard cevation al 15. Instructions: a) Make a column chart (or histogram) shcwing the simulated frequancf dlatr bution tor demand, us ng the bers prowided. Completed Below b) Use the couvmiF function to determine how many of the 2000 simulated inctsces had demand of less than 65 . c) Find the r-store that corresponds to a demand level oi 450ifm=500 and s=10 d) Lse the NORMSDIET tunzticn for the I scere of part |ci to find the thearetical probabilt, that demend is less than 450 . e) In theory. What level of dermand is ewoecded ooly 20 or the time? That 15 , a0s of the c) Find the z-score that correxponds to a demand level of 450Hm=500 and s=15. d) Lae the NOfmbOIST functian far the 2 scare af part |ci ta fivd tha thearetical probability that demand is less then 450. ef In theary, what lounl of demand is encended only 20% of then tima? That is, sof of the time, demsnd is this much or lege. Use the NDRMINV funct on to solve for this walue
Step by Step Solution
There are 3 Steps involved in it

Get step-by-step solutions from verified subject matter experts