

Question: please answer 7. Review the graph below: 1,000 800 600 400 200 1,000 2,000 3,000 4,000 5,000 Units of Output a. Estimate total costs of
please answer
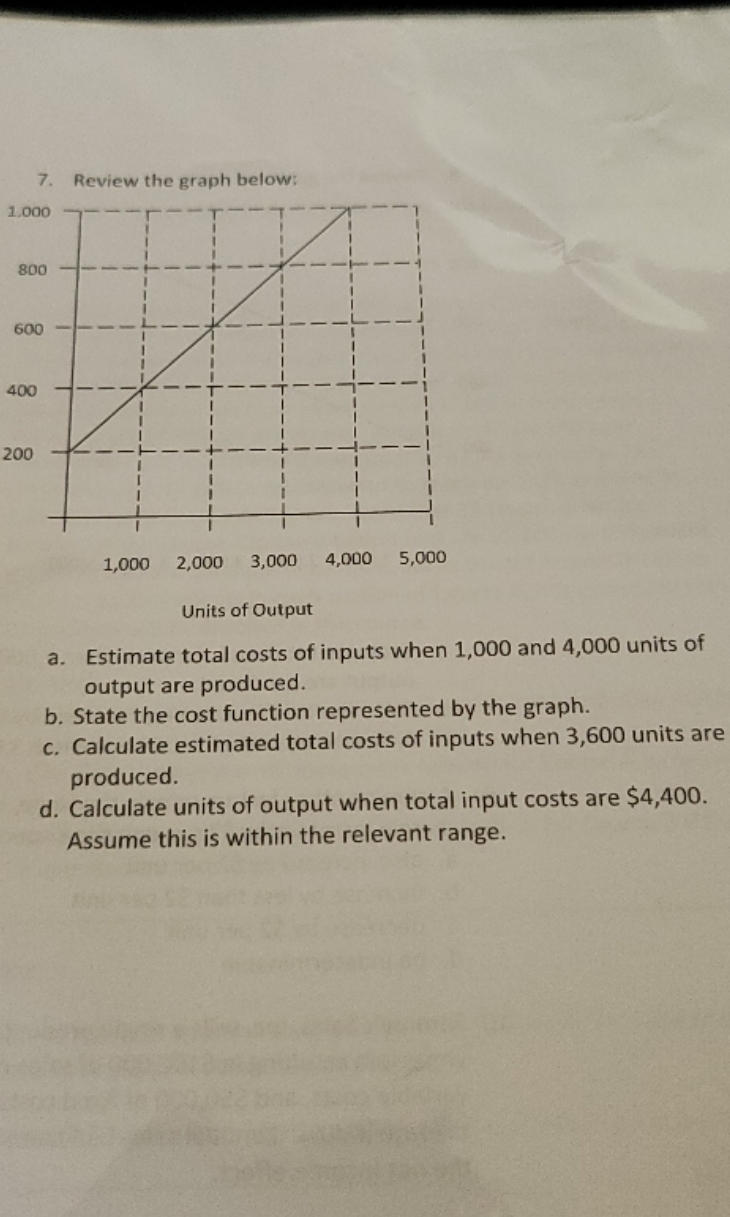
7. Review the graph below: 1,000 800 600 400 200 1,000 2,000 3,000 4,000 5,000 Units of Output a. Estimate total costs of inputs when 1,000 and 4,000 units of output are produced. b. State the cost function represented by the graph. c. Calculate estimated total costs of inputs when 3,600 units are produced. d. Calculate units of output when total input costs are $4,400. Assume this is within the relevant range
Step by Step Solution
There are 3 Steps involved in it
1 Expert Approved Answer
Step: 1 Unlock

Question Has Been Solved by an Expert!
Get step-by-step solutions from verified subject matter experts
Step: 2 Unlock
Step: 3 Unlock