

Question: please answer 8. Review the graph below: 1,000 800 600 400 200 1,000 2,000 3,000 4,000 5,000 Units of Output a. Estimate total cost of
please answer
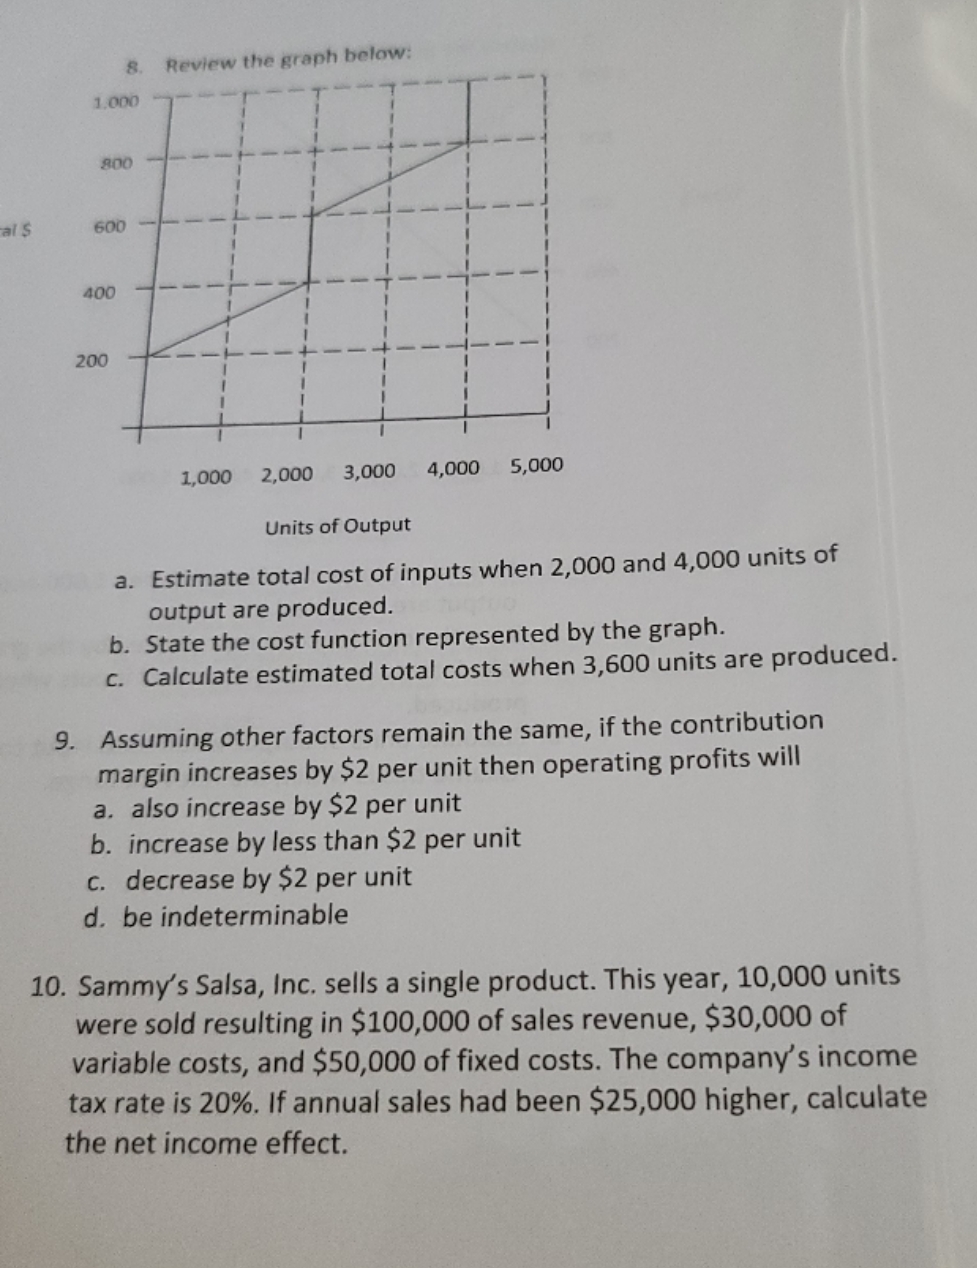
8. Review the graph below: 1,000 800 600 400 200 1,000 2,000 3,000 4,000 5,000 Units of Output a. Estimate total cost of inputs when 2,000 and 4,000 units of output are produced. b. State the cost function represented by the graph. c. Calculate estimated total costs when 3,600 units are produced. 9. Assuming other factors remain the same, if the contribution margin increases by $2 per unit then operating profits will a. also increase by $2 per unit b. increase by less than $2 per unit c. decrease by $2 per unit d. be indeterminable 10. Sammy's Salsa, Inc. sells a single product. This year, 10,000 units were sold resulting in $100,000 of sales revenue, $30,000 of variable costs, and $50,000 of fixed costs. The company's income tax rate is 20%. If annual sales had been $25,000 higher, calculate the net income effect
Step by Step Solution
There are 3 Steps involved in it

Get step-by-step solutions from verified subject matter experts