

Question: Please answer a and c, thanks. 1 In Exercise 6 of Chapter 2, data on numbers of publications were given for an SRS of 50

Please answer a and c, thanks.

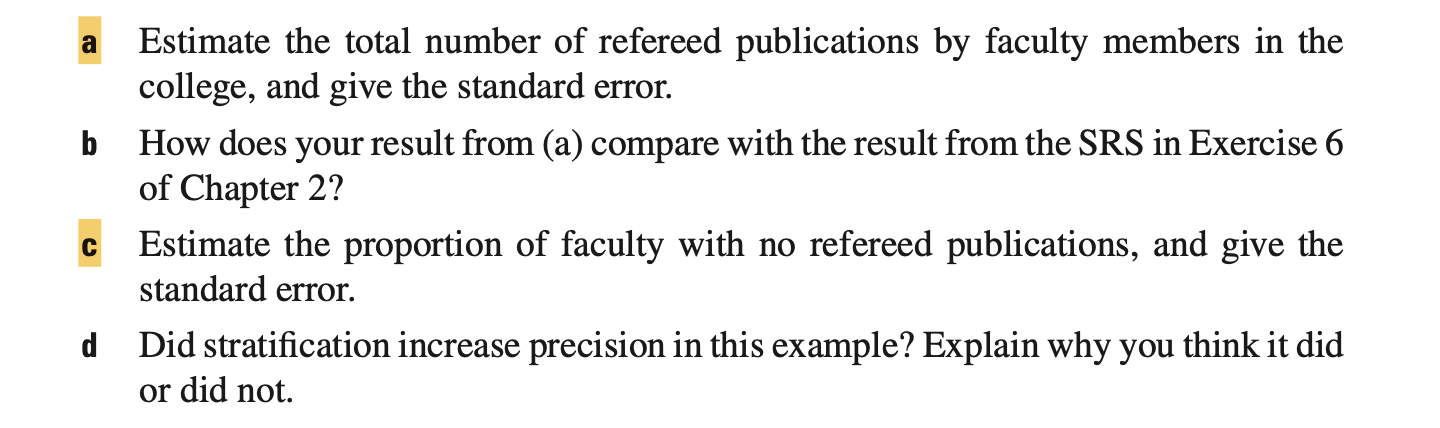
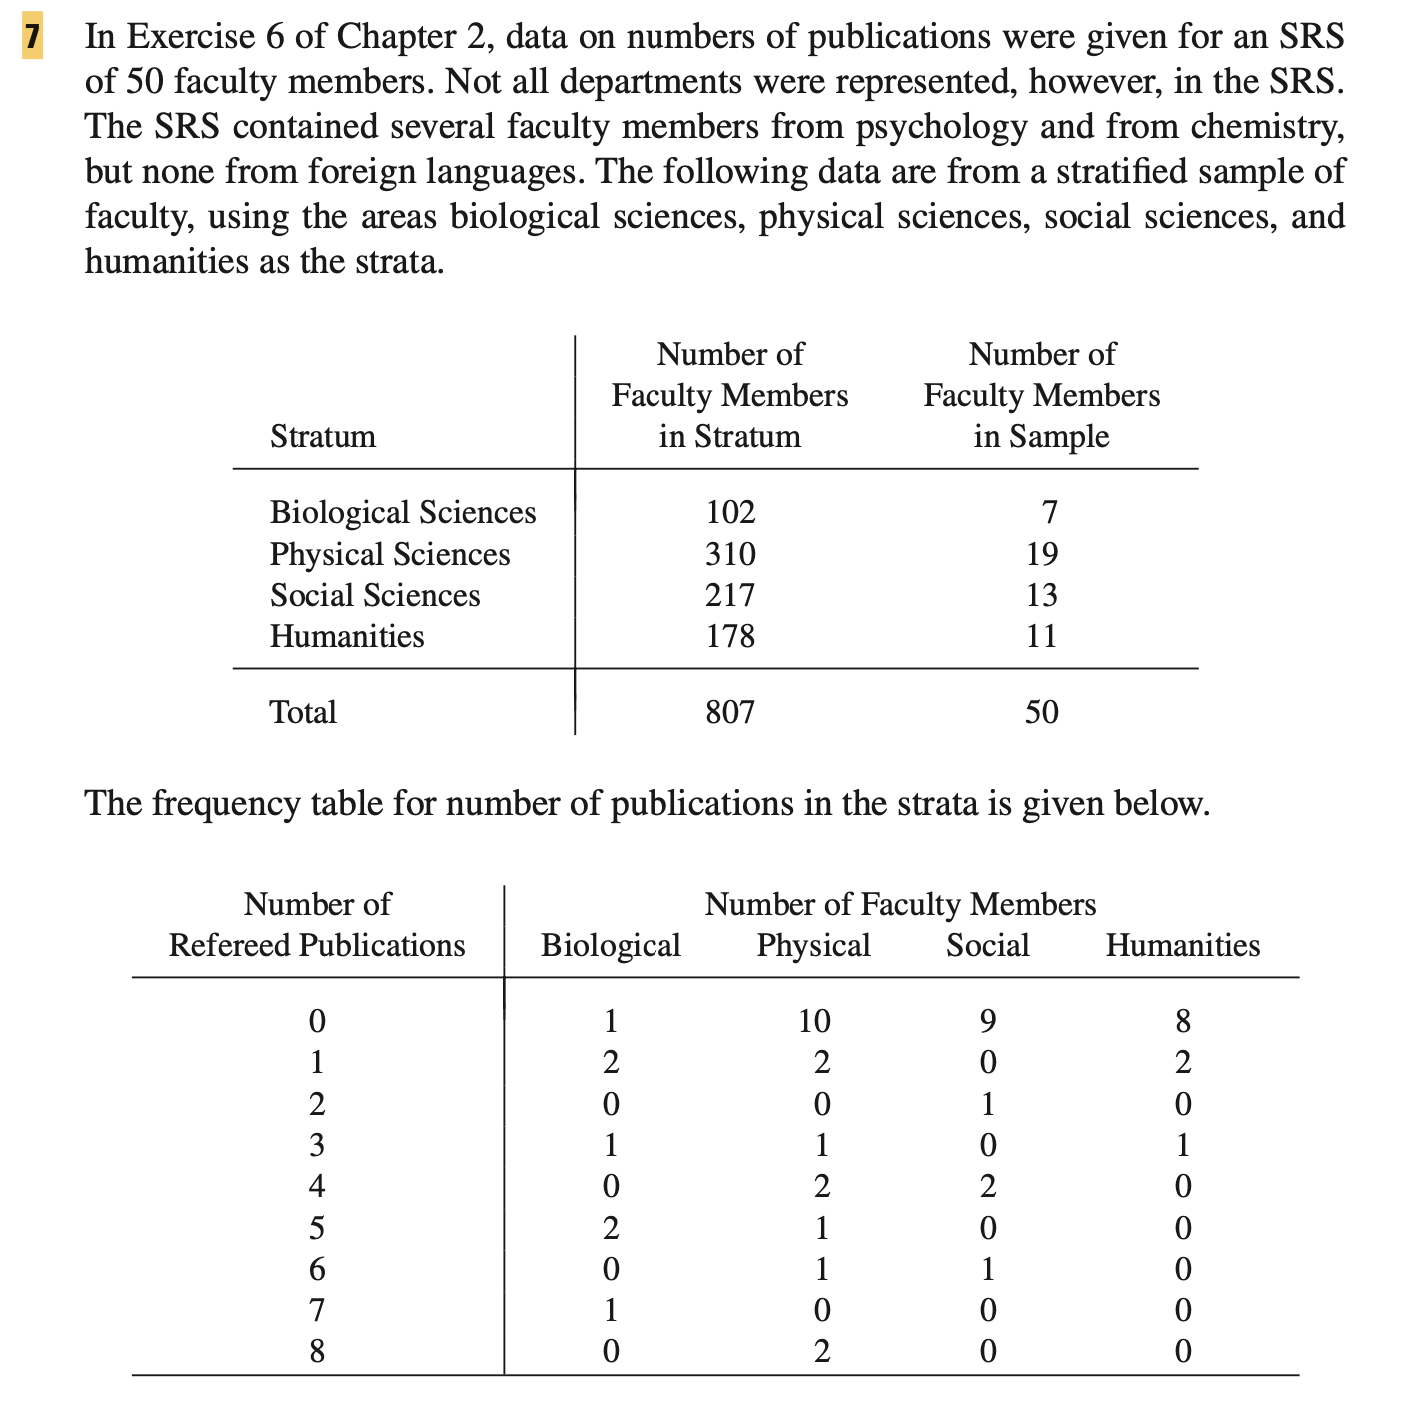
1 In Exercise 6 of Chapter 2, data on numbers of publications were given for an SRS of 50 faculty members. Not all departments were represented, however, in the SRS. The SRS contained several faculty members from psychology and from chemistry, but none from foreign languages. The following data are from a stratied sample of faculty, using the areas biological sciences, physical sciences, social sciences, and humanities as the strata. Number of Number of Faculty Members Faculty Members Stratum in Stratum in Sample Biological Sciences 102 7 Physical Sciences 3 10 19 Social Sciences 217 13 Humanities 17 8 1 1 Total 807 50 The frequency table for number of publications in the strata is given below. Number of Number of Faculty Members Refereed Publications Biological Physical Social Humanities NorIHNHONO OOQQU'I-b-UJNHO OHDNOHONH DovONOvOVD OOOOOHONOO Estimate the total number of refereed publications by faculty members in the college, and give the standard error. How does your result from (a) compare with the result from the SRS in Exercise 6 of Chapter 2? Estimate the proportion of faculty with no refereed publications, and give the standard error. Did stratication increase precision in this example? Explain why you think it did or did not
Step by Step Solution
There are 3 Steps involved in it

Get step-by-step solutions from verified subject matter experts