

Question: PLEASE ANSWER A , B , and C . A manufacturing process produces bottles that are supposed to have a volume of 5 0 0
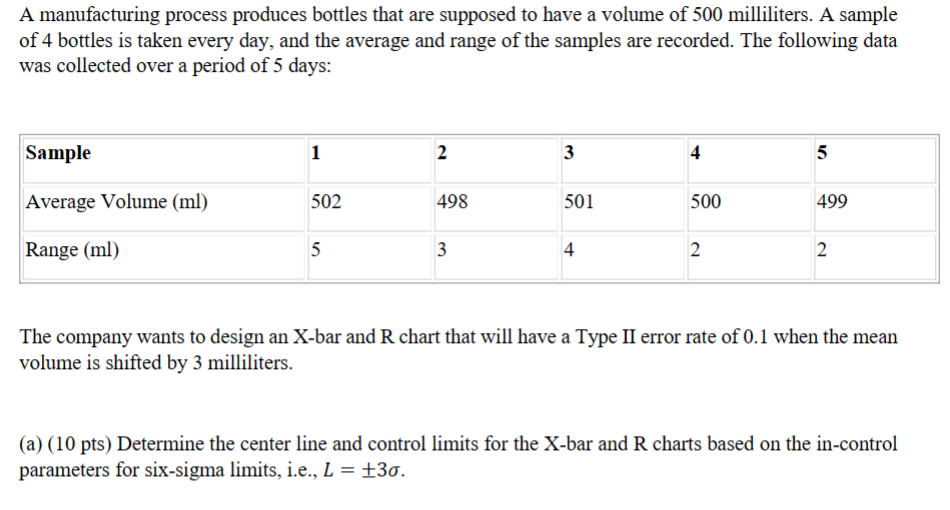
PLEASE ANSWER AB and C A manufacturing process produces bottles that are supposed to have a volume of milliliters. A sample of bottles is taken every day, and the average and range of the samples are recorded. The following data was collected over a period of days: The company wants to design an Xbar and R chart that will have a Type II error rate of when the mean volume is shifted by milliliters.
a pts Determine the center line and control limits for the Xbar and R charts based on the incontrol parameters for sixsigma limits ie Lpm sigma
b pts Determine the value of delta the shift in the mean volume that will result in a Type II error rate of
c pts Redesign the Xbar and R charts to achieve a Type II error rate of for the shift of millimeters in the mean volume. What is the new UCL for the Xbar char? What is the new LCL for the Xbar chart? What is the new UCL for the R chart? What is the new LCL for the R chart?
Step by Step Solution
There are 3 Steps involved in it
1 Expert Approved Answer
Step: 1 Unlock

Question Has Been Solved by an Expert!
Get step-by-step solutions from verified subject matter experts
Step: 2 Unlock
Step: 3 Unlock