

Question: Please answer A, B, and C. Thank you! 3. Bending the Rules We were introduced to the NHTSA's 1998 San Diego field sobriety test validation
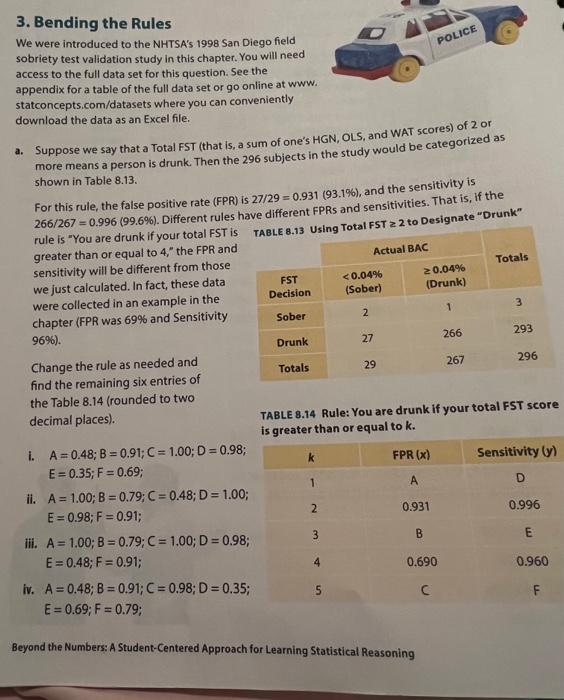
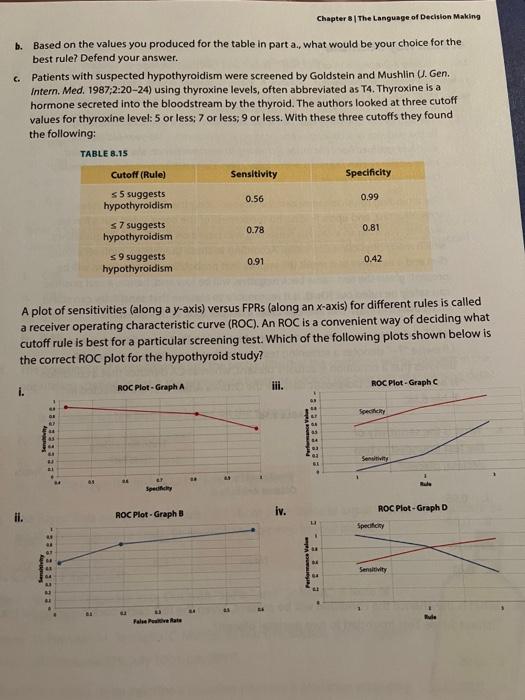
3. Bending the Rules We were introduced to the NHTSA's 1998 San Diego field sobriety test validation study in this chapter. You will need access to the full data set for this question. See the appendix for a table of the full data set or go online at www. statconcepts.com/datasets where you can conveniently download the data as an Excel file. a. Suppose we say that a Total FST (that is, a sum of one's HGN, OLS, and WAT scores) of 2 or more means a person is drunk. Then the 296 subjects in the study would be categorized as shown in Table 8.13. For this rule, the false positive rate (FPR) is 27/29=0.931(93.1%), and the sensitivity is 266/267=0.996(99.6%). Different rules have different FPRs and sensitivities. That is, If the rule is "You are drunk if your total FST is greater than or equal to 4 ," the FPR and sensitivity will be different from those we just calculated. In fact, these data were collected in an example in the chapter (FPR was 69% and Sensitivity 96% ). Change the rule as needed and find the remaining six entries of the Table 8.14 (rounded to two decimal places). TABLE 8.14 Rule: You are drunk if your total FST score is greater than or equal to k. i. A=0.48;B=0.91;C=1.00;D=0.98; E=0.35;F=0.69; ii. A=1.00;B=0.79;C=0.48;D=1.00; E=0.98;F=0.91; iii. A=1.00;B=0.79;C=1.00;D=0.98; E=0.48;F=0.91 iv. A=0.48;B=0.91;C=0.98;D=0.35; E=0.69;F=0.79 Beyond the Numbers: A Student-Centered Approach for Learning Statistical Reasoning Chapter 8 The Language of Decislon Making b. Based on the values you produced for the table in part a., what would be your choice for the best rule? Defend your answer. c. Patients with suspected hypothyroidism were screened by Goldstein and Mushlin U. Gen. Intern. Med. 1987;2:20-24) using thyroxine levels, often abbreviated as T4. Thyroxine is a hormone secreted into the bloodstream by the thyroid. The authors looked at three cutoff values for thyroxine level: 5 or less; 7 or less; 9 or less. With these three cutoffs they found the following: TABLE B.15 A plot of sensitivities (along a y-axis) versus FPRs (along an x-axis) for different rules is called a receiver operating characteristic curve (ROC). An ROC is a convenient way of deciding what cutoff rule is best for a particular screening test. Which of the following plots shown below is the correct ROC plot for the hypothyroid study? 3. Bending the Rules We were introduced to the NHTSA's 1998 San Diego field sobriety test validation study in this chapter. You will need access to the full data set for this question. See the appendix for a table of the full data set or go online at www. statconcepts.com/datasets where you can conveniently download the data as an Excel file. a. Suppose we say that a Total FST (that is, a sum of one's HGN, OLS, and WAT scores) of 2 or more means a person is drunk. Then the 296 subjects in the study would be categorized as shown in Table 8.13. For this rule, the false positive rate (FPR) is 27/29=0.931(93.1%), and the sensitivity is 266/267=0.996(99.6%). Different rules have different FPRs and sensitivities. That is, If the rule is "You are drunk if your total FST is greater than or equal to 4 ," the FPR and sensitivity will be different from those we just calculated. In fact, these data were collected in an example in the chapter (FPR was 69% and Sensitivity 96% ). Change the rule as needed and find the remaining six entries of the Table 8.14 (rounded to two decimal places). TABLE 8.14 Rule: You are drunk if your total FST score is greater than or equal to k. i. A=0.48;B=0.91;C=1.00;D=0.98; E=0.35;F=0.69; ii. A=1.00;B=0.79;C=0.48;D=1.00; E=0.98;F=0.91; iii. A=1.00;B=0.79;C=1.00;D=0.98; E=0.48;F=0.91 iv. A=0.48;B=0.91;C=0.98;D=0.35; E=0.69;F=0.79 Beyond the Numbers: A Student-Centered Approach for Learning Statistical Reasoning Chapter 8 The Language of Decislon Making b. Based on the values you produced for the table in part a., what would be your choice for the best rule? Defend your answer. c. Patients with suspected hypothyroidism were screened by Goldstein and Mushlin U. Gen. Intern. Med. 1987;2:20-24) using thyroxine levels, often abbreviated as T4. Thyroxine is a hormone secreted into the bloodstream by the thyroid. The authors looked at three cutoff values for thyroxine level: 5 or less; 7 or less; 9 or less. With these three cutoffs they found the following: TABLE B.15 A plot of sensitivities (along a y-axis) versus FPRs (along an x-axis) for different rules is called a receiver operating characteristic curve (ROC). An ROC is a convenient way of deciding what cutoff rule is best for a particular screening test. Which of the following plots shown below is the correct ROC plot for the hypothyroid study
Step by Step Solution
There are 3 Steps involved in it

Get step-by-step solutions from verified subject matter experts