

Question: please answer a b c The figure to the right shows the number of full-time employees of a company (in millions) as a function o
please answer a b c 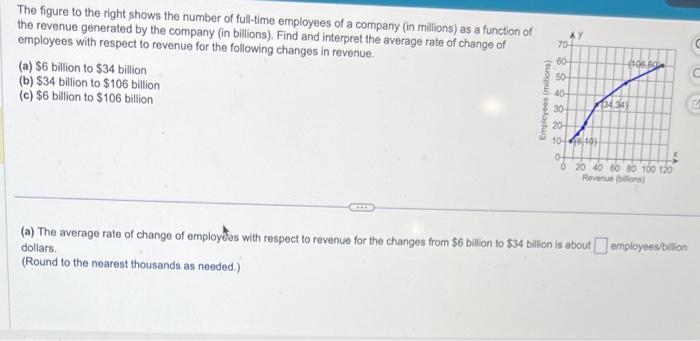
The figure to the right shows the number of full-time employees of a company (in millions) as a function o the revenue generated by the company (in billions). Find and interpret the average rate of change of employees with respect to revenue for the following changes in revenue. (a) $6 billion to $34 billion (b) $34 billion to $106 billion (c) $6 billion to $106 billion (a) The average rate of change of employes with respect to revenue for the changes from $6 billion to $34 billion is about. employees/billon dollars. (Round to the nearest thousands as needed.)
Step by Step Solution
There are 3 Steps involved in it
1 Expert Approved Answer
Step: 1 Unlock

Question Has Been Solved by an Expert!
Get step-by-step solutions from verified subject matter experts
Step: 2 Unlock
Step: 3 Unlock