

Question: Please answer A through D thank you!! Interpreting llquidity and activity ratios The table. shows key financial data for three frms that compese in tho
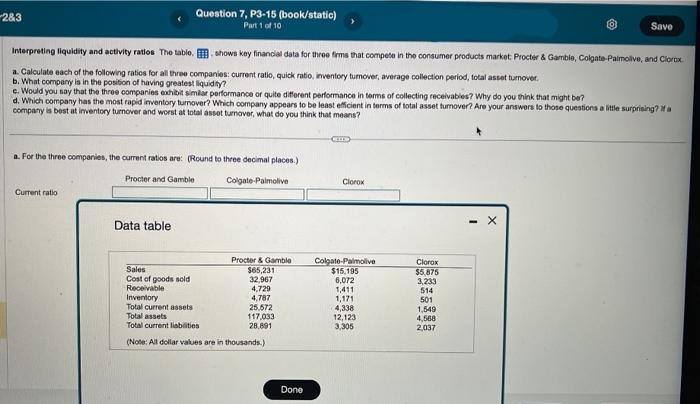
Interpreting llquidity and activity ratios The table. "shows key financial data for three frms that compese in tho consumer products market. Procter 8 Gamble, Colgate. Paimolive, and Ciornx. a. Calculate each of the following ratios for ail three companies: current ratio, quick ratio, imventory tumover, average collection period, total asset hamover. b. What company is in the positon of having greatest liquid ty? e. Would you nay that the three comparies echioit simiar performance or quite ditforent performance in terms of collecting receivabies? Why do you think that might be? d. Which company has the most rapid inventory turnover? Which company appears to be least etficient in terms of total asset tumover? Are your answers to those questions a ittle surprieing? y a compary is best at inventory turnover and worst at total assot tumover, what do you think that means? a. For the three comperies, the current ratos are: (Round to three decimal places.) Procier and Gamble Curtent ratio Data table
Step by Step Solution
There are 3 Steps involved in it

Get step-by-step solutions from verified subject matter experts