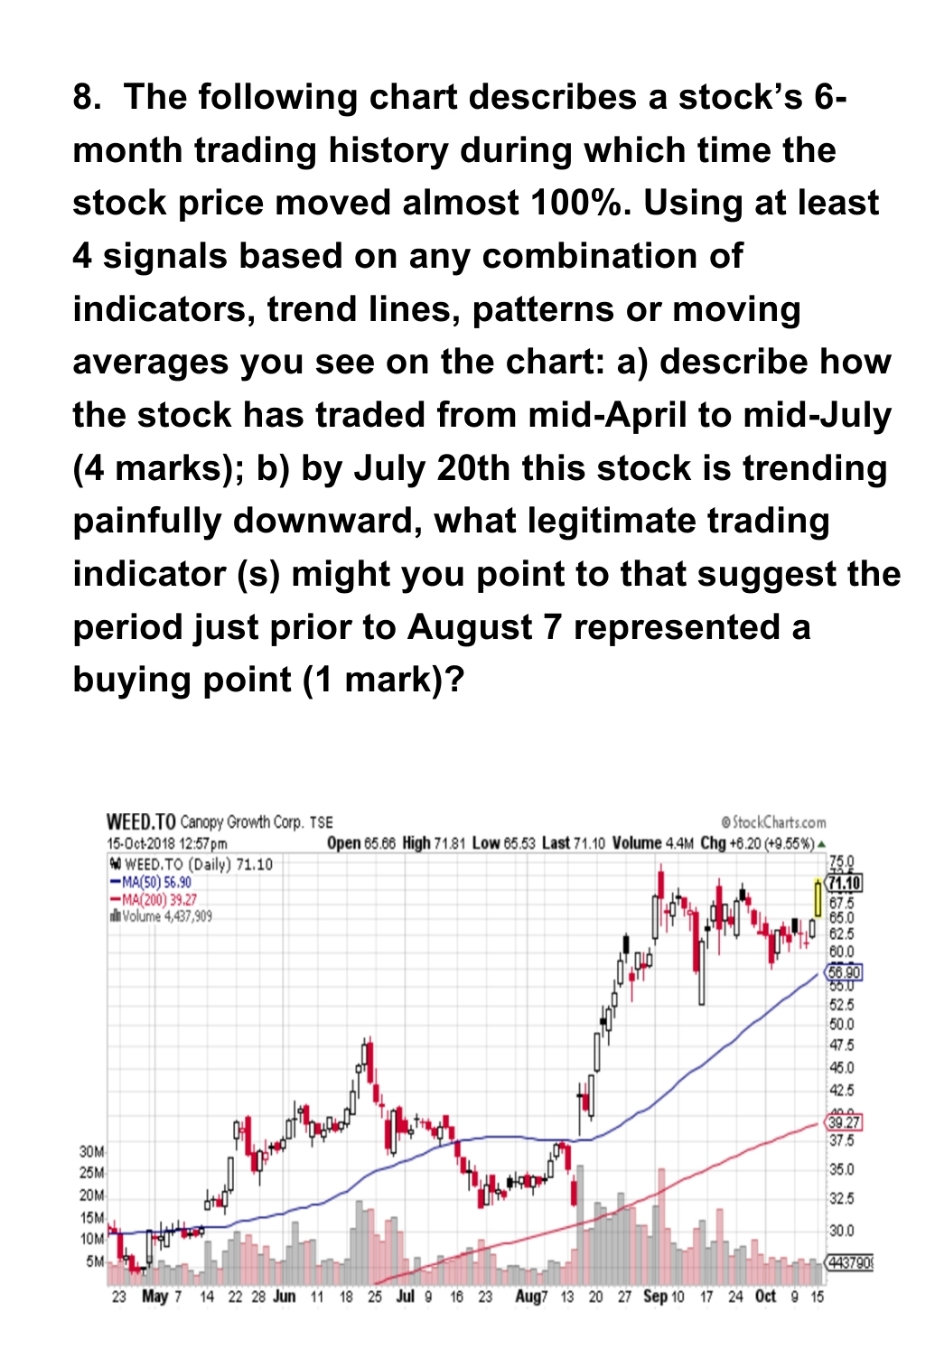
Question: Please answer according to the graph, completely and to the point 8. The following chart describes a stock's 6- month trading history during which time

Please answer according to the graph, completely and to the point

Please answer according to the graph, completely
8. The following chart describes a stock's 6- month trading history during which time the stock price moved almost 100%. Using at least 4 signals based on any combination of indicators, trend lines, patterns or moving averages you see on the chart: a) describe how the stock has traded from mid-April to mid-July (4 marks); b) by July 20th this stock is trending painfully downward, what legitimate trading indicator (s) might you point to that suggest the period just prior to August 7 represented a buying point (1 mark)? WEED.TO Canopy Growth Corp. TSE @StockCharts.com 15-Oct.2018 12:57pm Open 65.66 High 71.81 Low 65.53 Last 71.10 Volume 4.4M Chg +6.20 (+9.55%) M WEED. TO (Daily) 71.10 75.0 -MA(50) 56.90 71.10 -MA(200) 39.27 67.5 in Volume 4,437,909 65.0 40 62.5 60.0 56.90 55 1 52.5 50.0 47.5 45.0 42.5 39.27 37 .5 30M 25M 35.0 20M 32.5 15MM 10M 30.0 5M 443790 23 May 7 14 22 28 Jun 11 18 25 Jul 9 16 23 Aug7 13 20 27 Sep 10 17 24 Oct 9 15

Step by Step Solution

There are 3 Steps involved in it

1 Expert Approved Answer
Step: 1 Unlock blur-text-image
Question Has Been Solved by an Expert!

Get step-by-step solutions from verified subject matter experts

Step: 2 Unlock
Step: 3 Unlock

Students Have Also Explored These Related Finance Questions!