

Question: Please answer a-f 2. Copy and paste the following data into Excel: P Q $210.00 5415 $205.80 5553 $203.70 5783 $195.30 5958 $184.80 6115 $182.70
Please answer a-f
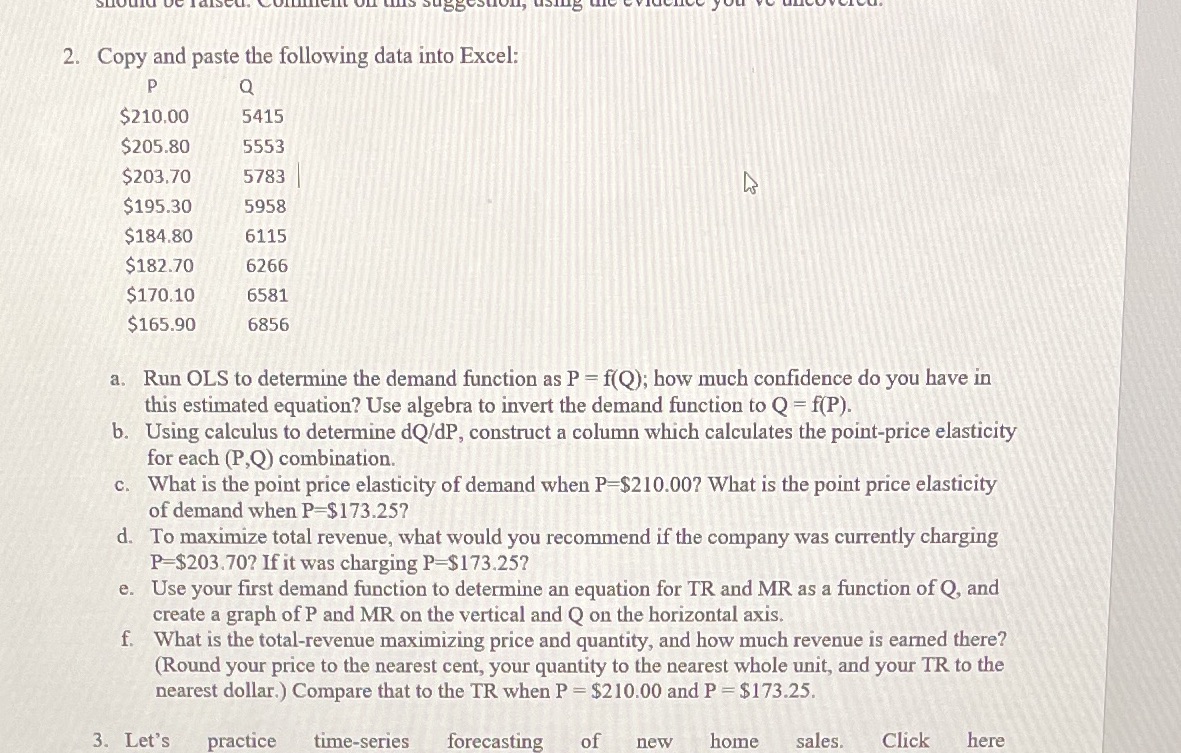
2. Copy and paste the following data into Excel: P Q $210.00 5415 $205.80 5553 $203.70 5783 $195.30 5958 $184.80 6115 $182.70 6266 $170.10 6581 $165.90 6856 a. Run OLS to determine the demand function as P = f(Q); how much confidence do you have in this estimated equation? Use algebra to invert the demand function to Q = f(P). b. Using calculus to determine dQ/dP, construct a column which calculates the point-price elasticity for each (P,Q) combination. c. What is the point price elasticity of demand when P-$210.00? What is the point price elasticity of demand when P=$173.257 d. To maximize total revenue, what would you recommend if the company was currently charging P-$203.70? If it was charging P-$173.25? e. Use your first demand function to determine an equation for TR and MR as a function of Q, and create a graph of P and MR on the vertical and Q on the horizontal axis. f. What is the total-revenue maximizing price and quantity, and how much revenue is earned there? (Round your price to the nearest cent, your quantity to the nearest whole unit, and your TR to the nearest dollar.) Compare that to the TR when P = $210.00 and P = $173.25. 3. Let's practice time-series forecasting of new home sales. Click here
Step by Step Solution
There are 3 Steps involved in it

Get step-by-step solutions from verified subject matter experts