

Question: Please answer all 2. a-f using the information below: fFittedljnallul: Hmm=511L33uEmimdwlw Feta-autumn: Hummzmmmoumm E marl-my min-at 'B e {a} Treating the given data as being
Please answer all 2. a-f using the information below:
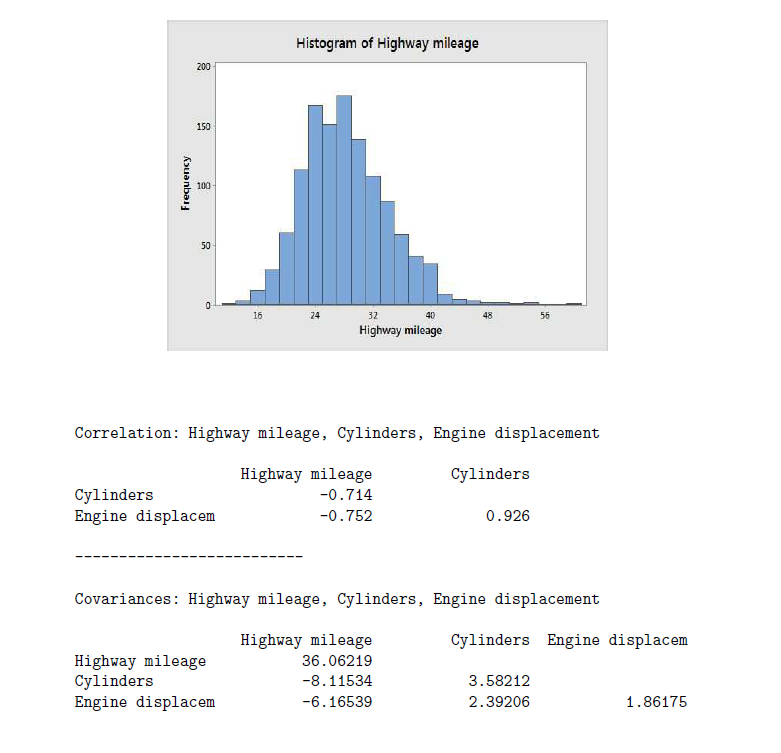
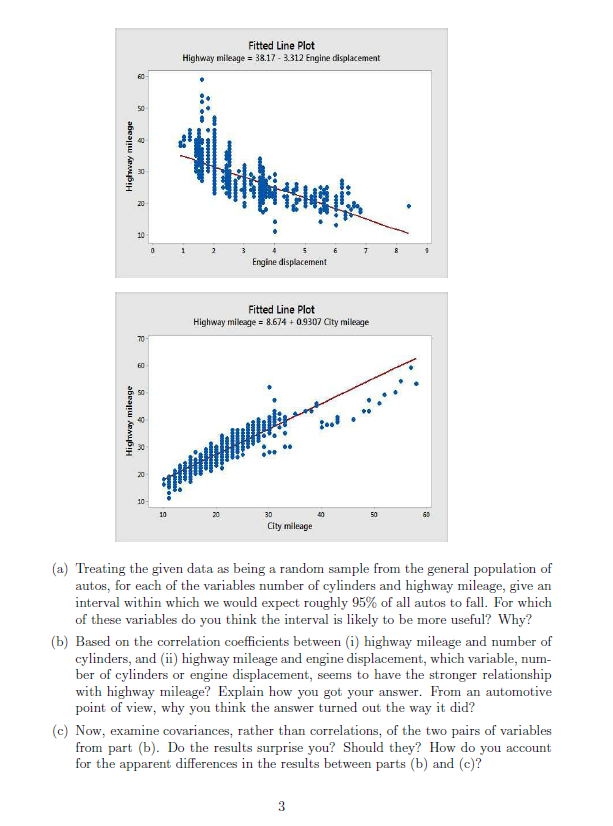
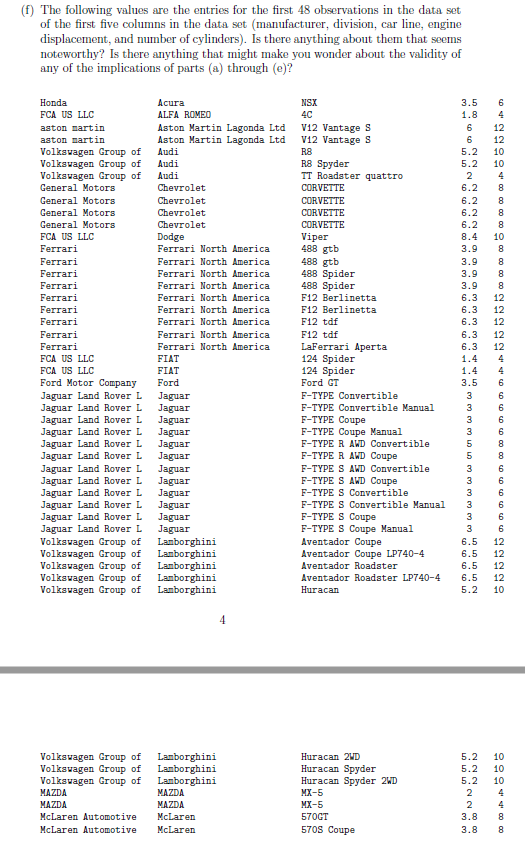
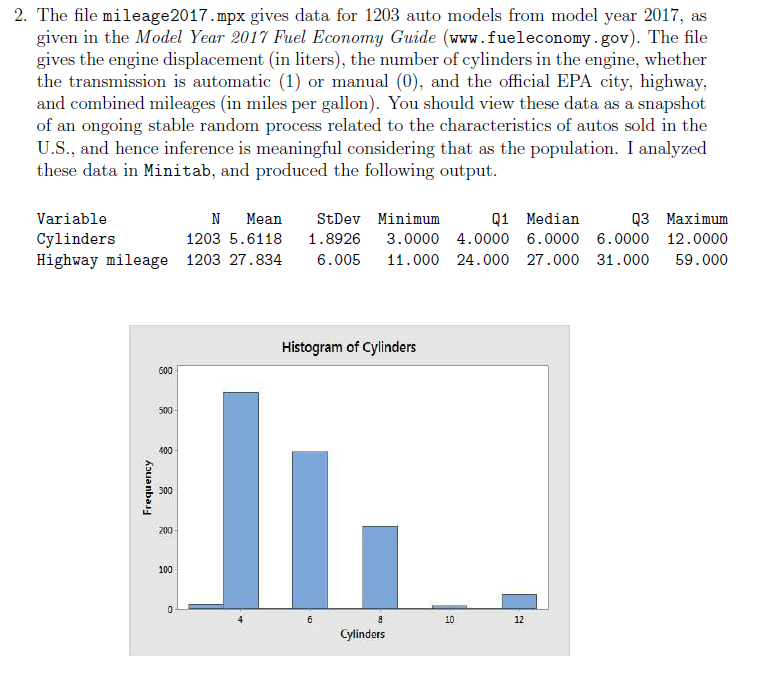
\fFittedljnallul: Hmm=511L33uEmimdwlw Feta-autumn: Hummzmmmoumm E marl-my min-at 'B e {a} Treating the given data as being a random sample from the general population of autos, for each of the variables: number of cylinst and highway mileage, give an interval within which we would expect roughly 95% of all autos to fall. For which of these variables do you think the interval is likely to be more useful? 1|villi-11y? Eb} Based on the correlation ooeicients between {i} highway mileage and number of cylinders, and {ii} highway mileage and engine displacement, which variable, num- ber of cylinders or engine displacement, seems to have the stronger relationship with highway mileage? Explain how you got your answer. From an automotive point of view, why you think the answer turned out the way it did? {c} Now, examine covariances, rather than correlations, of the two pairs of variables from part {b}. Do the results surprise you? Should they? How do you account for the apparent diEerenc-es in the results between parts [b] and [c]? \f2. The le mileageE 1T.mpx gives data for 12133 auto models from model year QUIT\
Step by Step Solution
There are 3 Steps involved in it

Get step-by-step solutions from verified subject matter experts