

Question: Please Answer all. 3. (20 Points) a) Divide the following set of 20 forest plots into equal-interval categories based on the number of diseased trees
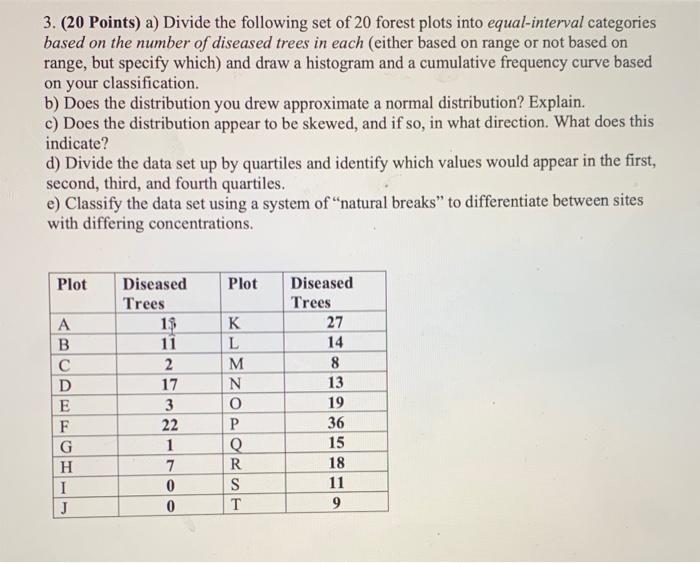
3. (20 Points) a) Divide the following set of 20 forest plots into equal-interval categories based on the number of diseased trees in each (either based on range or not based on range, but specify which) and draw a histogram and a cumulative frequency curve based on your classification. b) Does the distribution you drew approximate a normal distribution? Explain. c) Does the distribution appear to be skewed, and if so, in what direction. What does this indicate? d) Divide the data set up by quartiles and identify which values would appear in the first, second, third, and fourth quartiles. e) Classify the data set using a system of natural breaks" to differentiate between sites with differing concentrations. Plot Plot A B D E F G H 1 J Diseased Trees 13 11 2 17 3 22 1 7 0 0 K L M N O P Q R S T Diseased Trees 27 14 8 13 19 36 15 18 11 9
Step by Step Solution
There are 3 Steps involved in it

Get step-by-step solutions from verified subject matter experts