

Question: Question No. 1 Parameters do not allow users to insert their values, which can be integers, float, date, string that can be used to
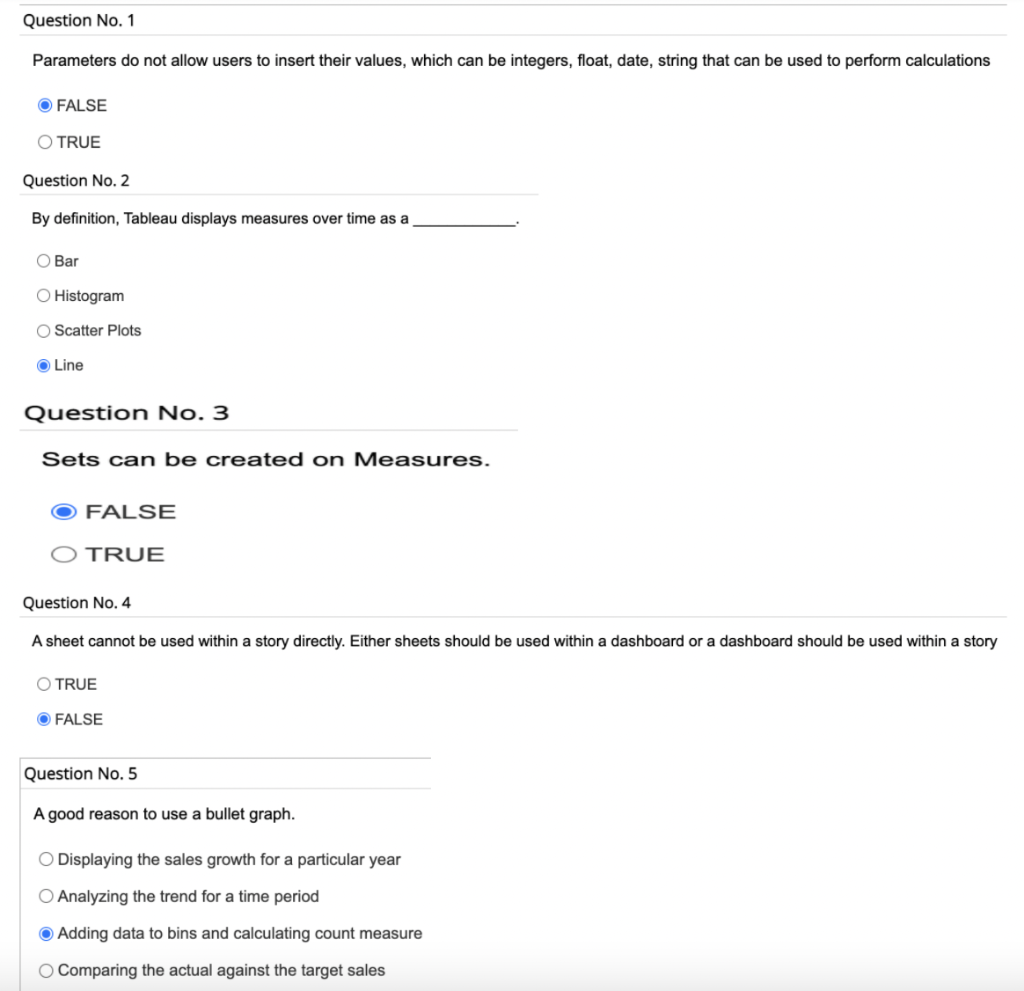
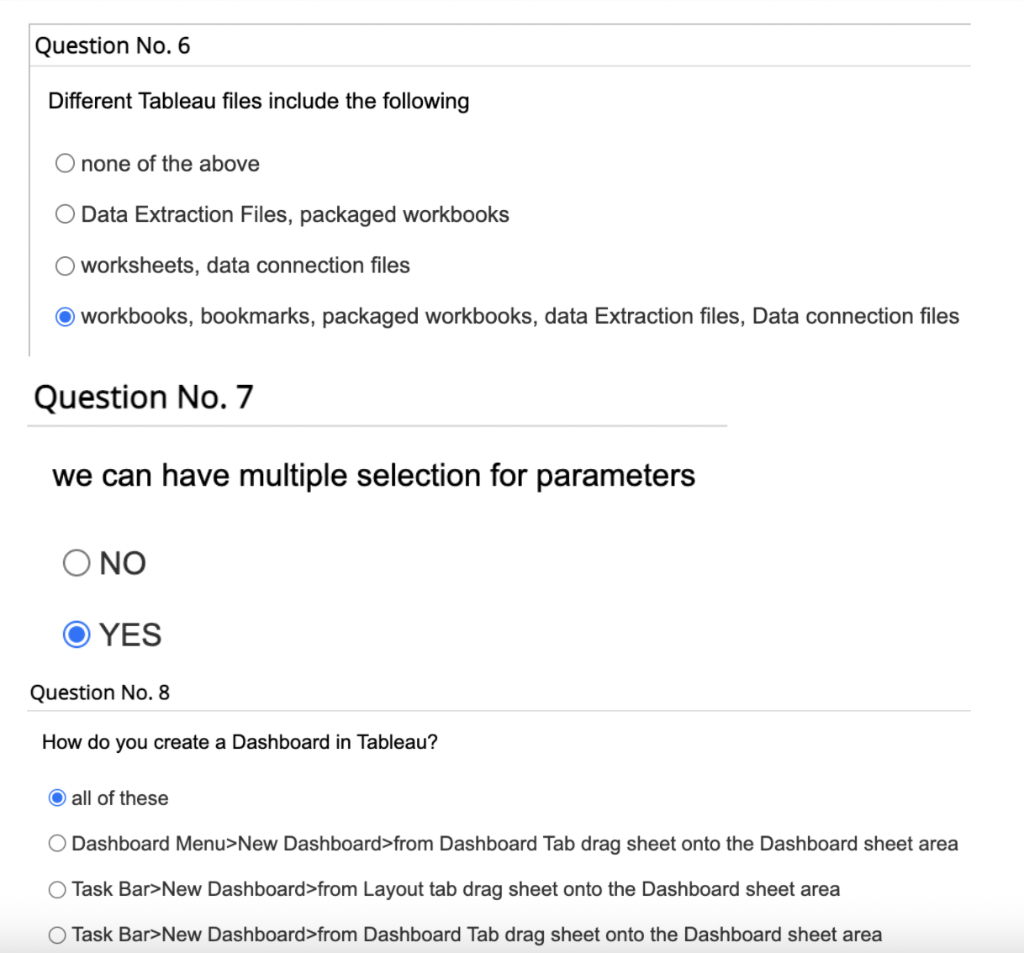
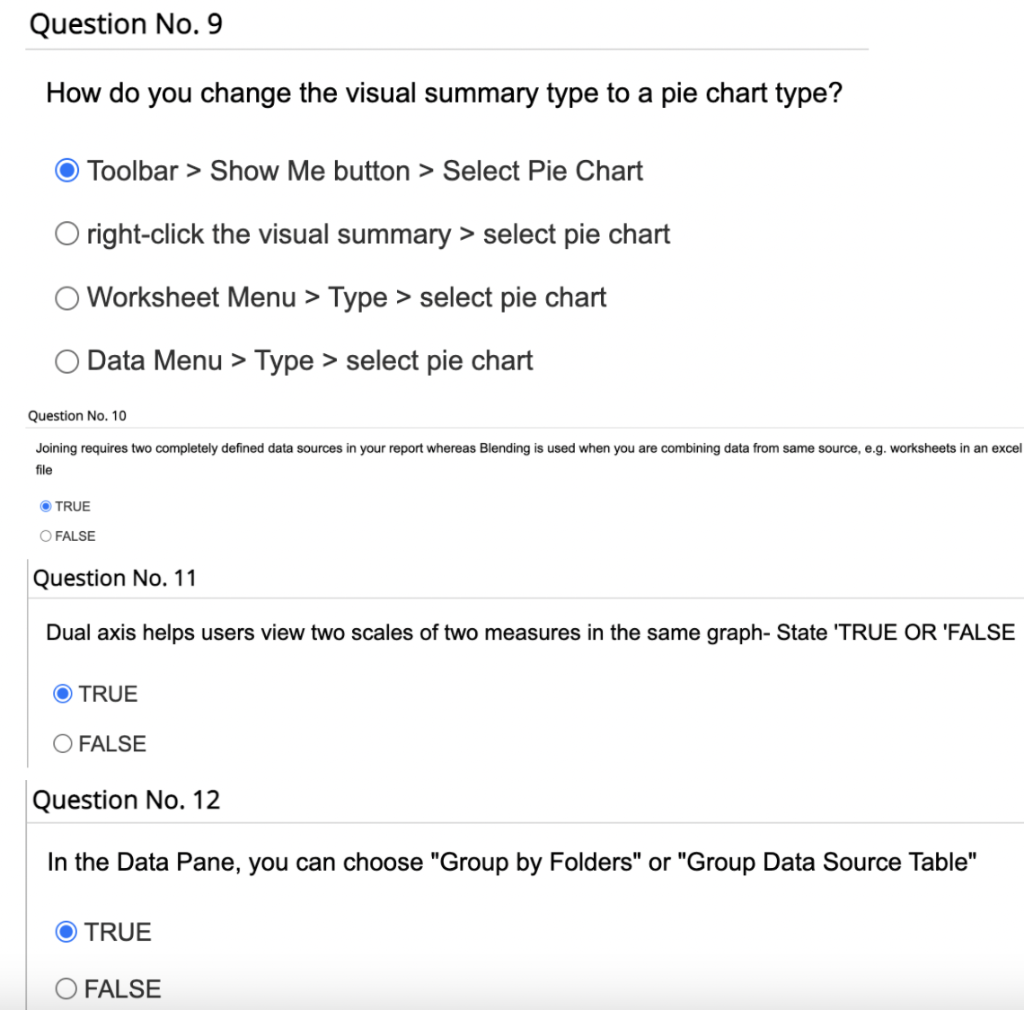
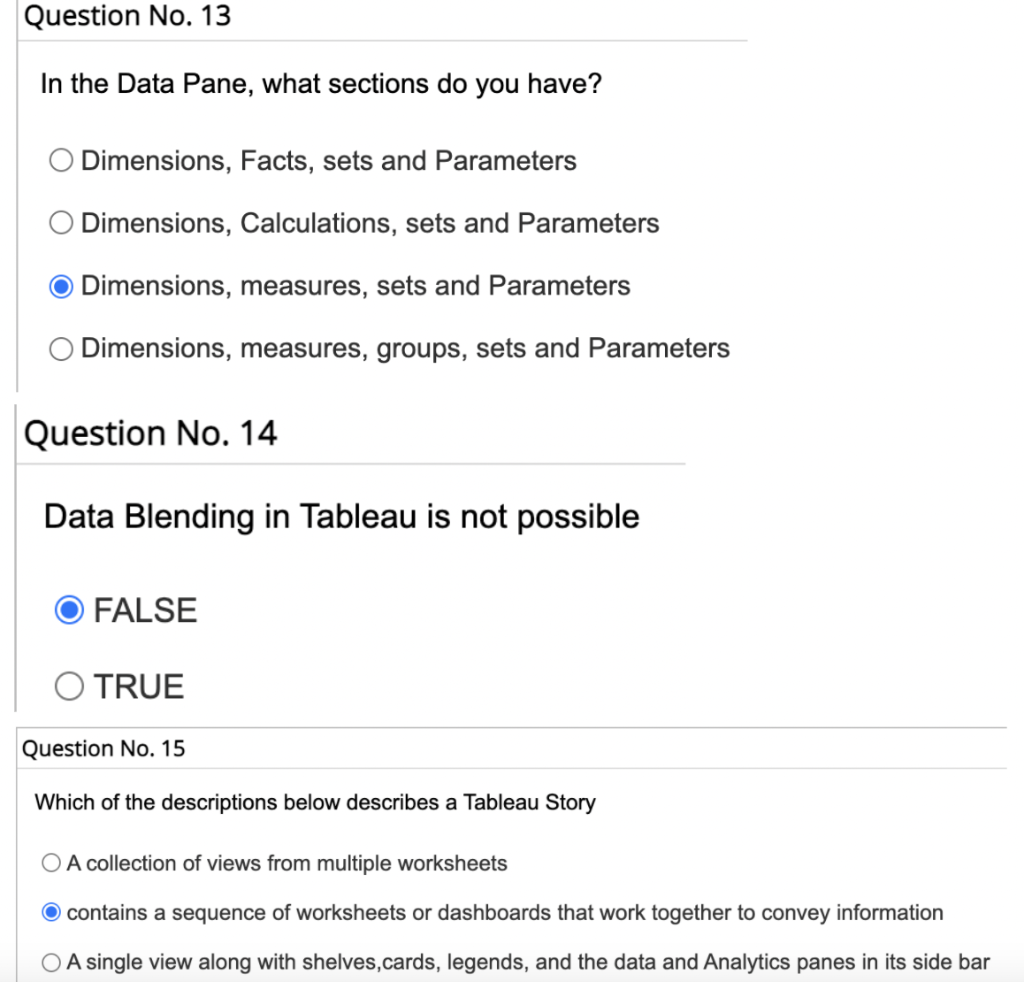
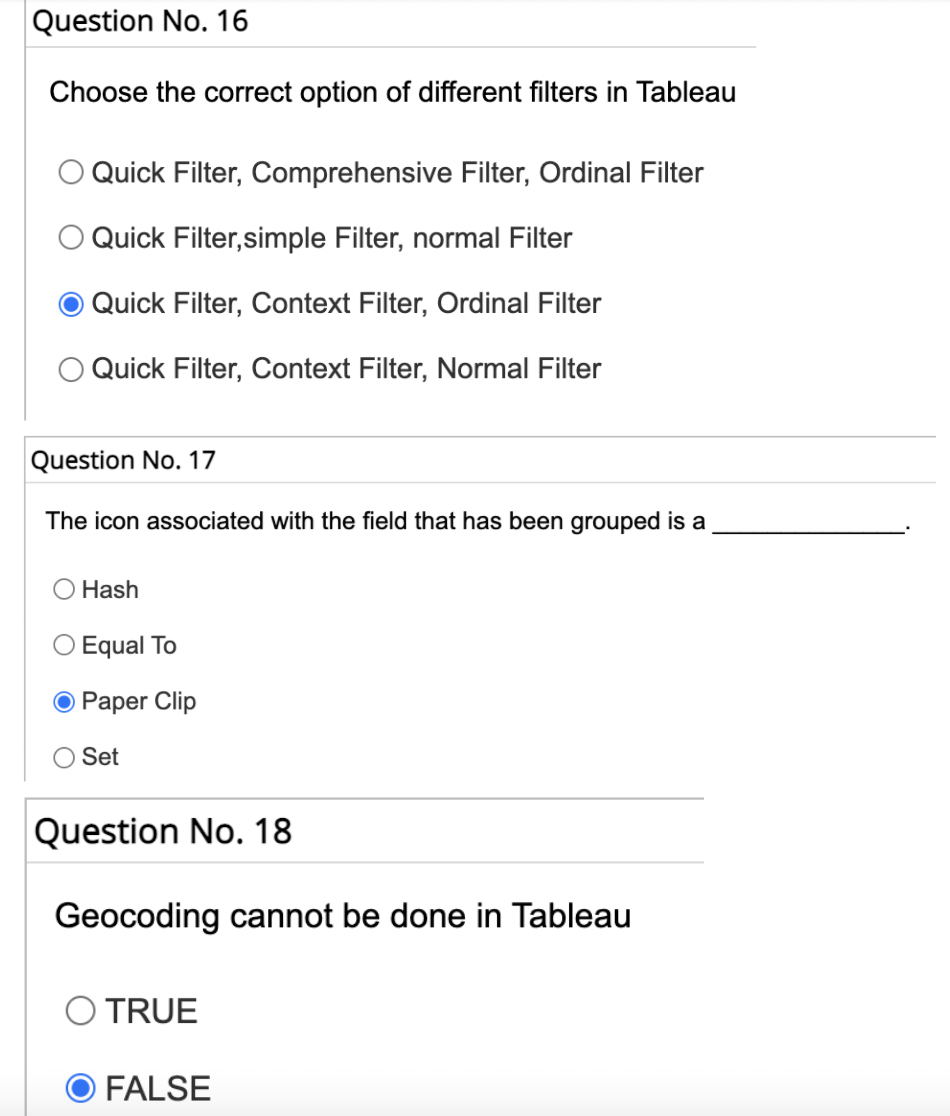
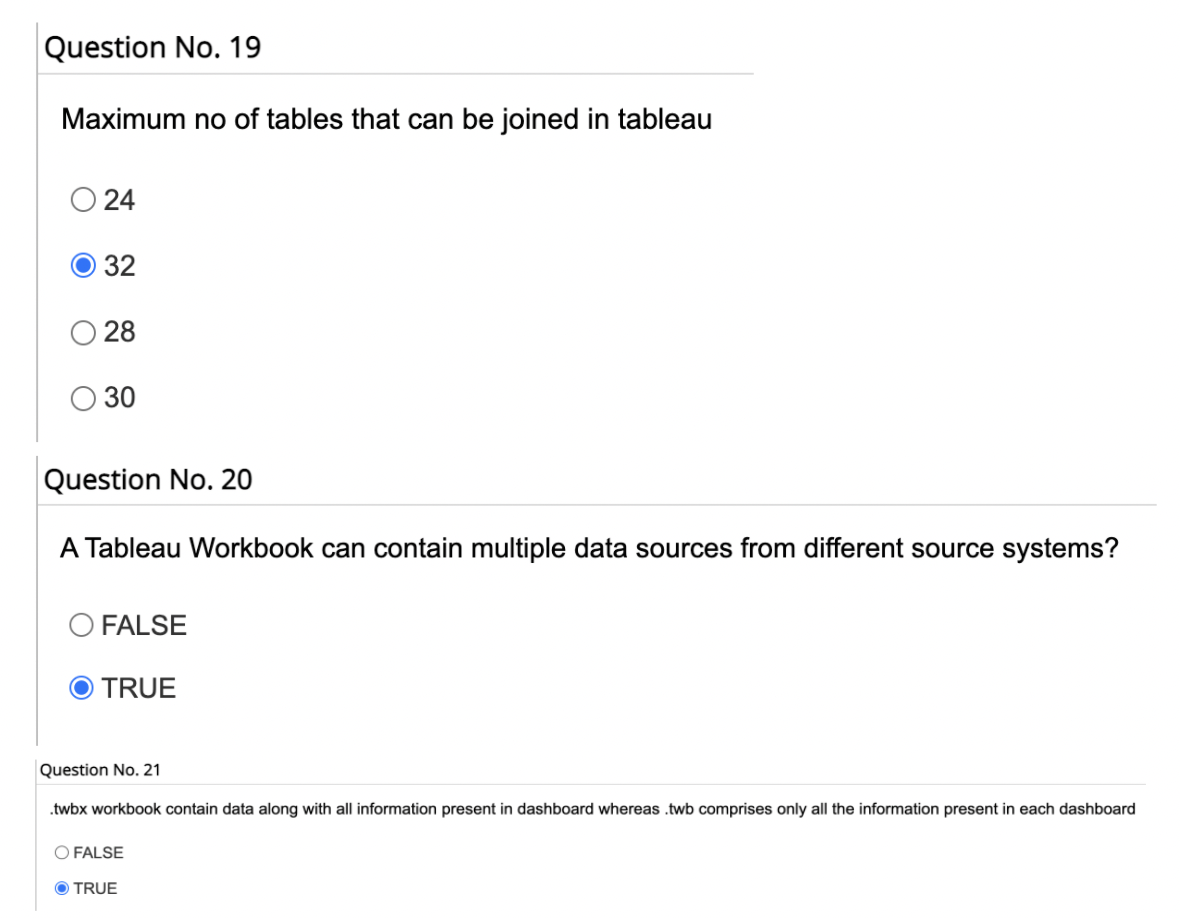
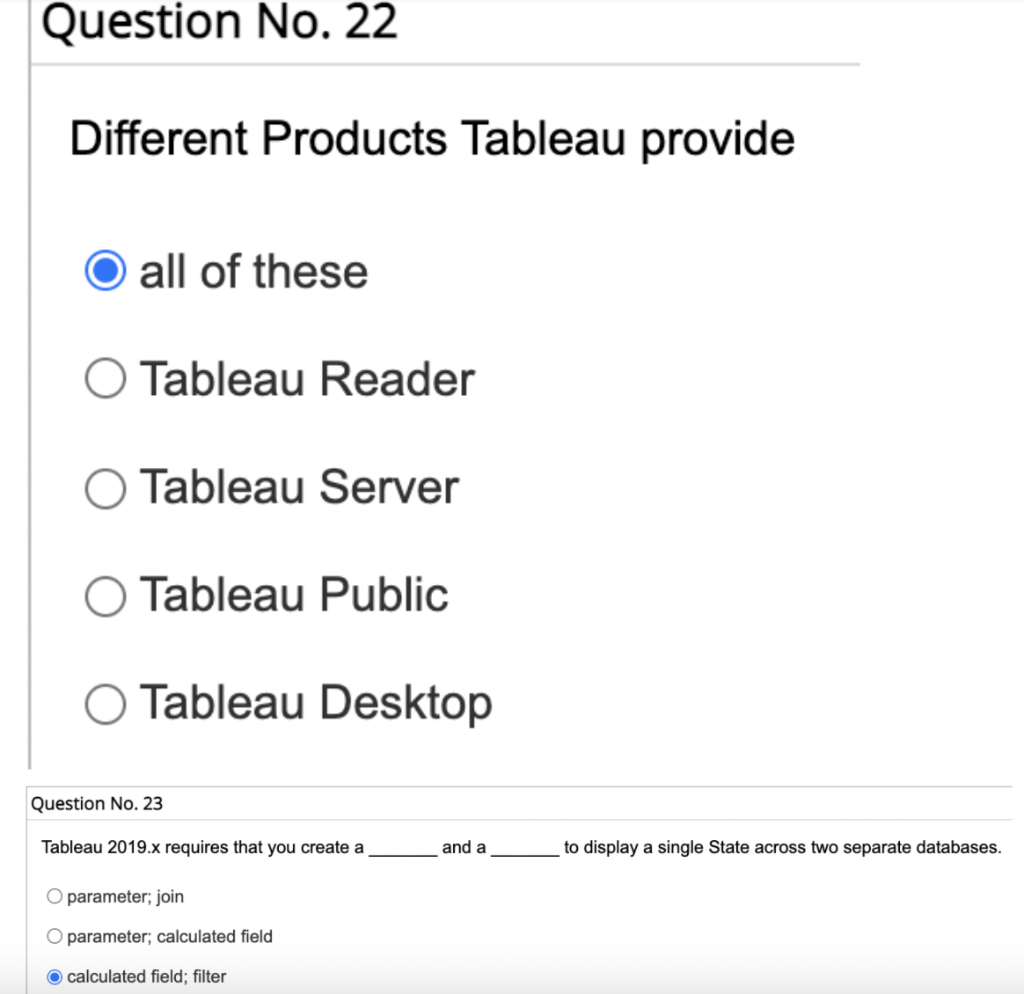
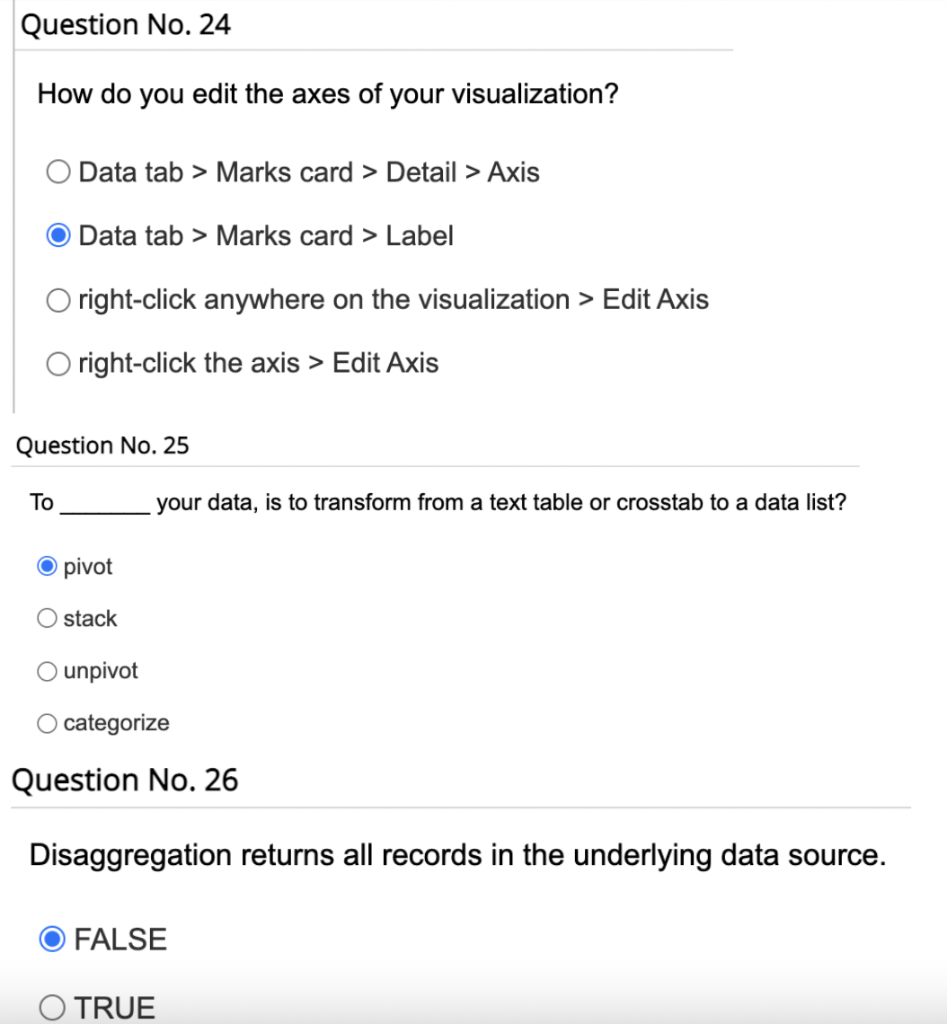
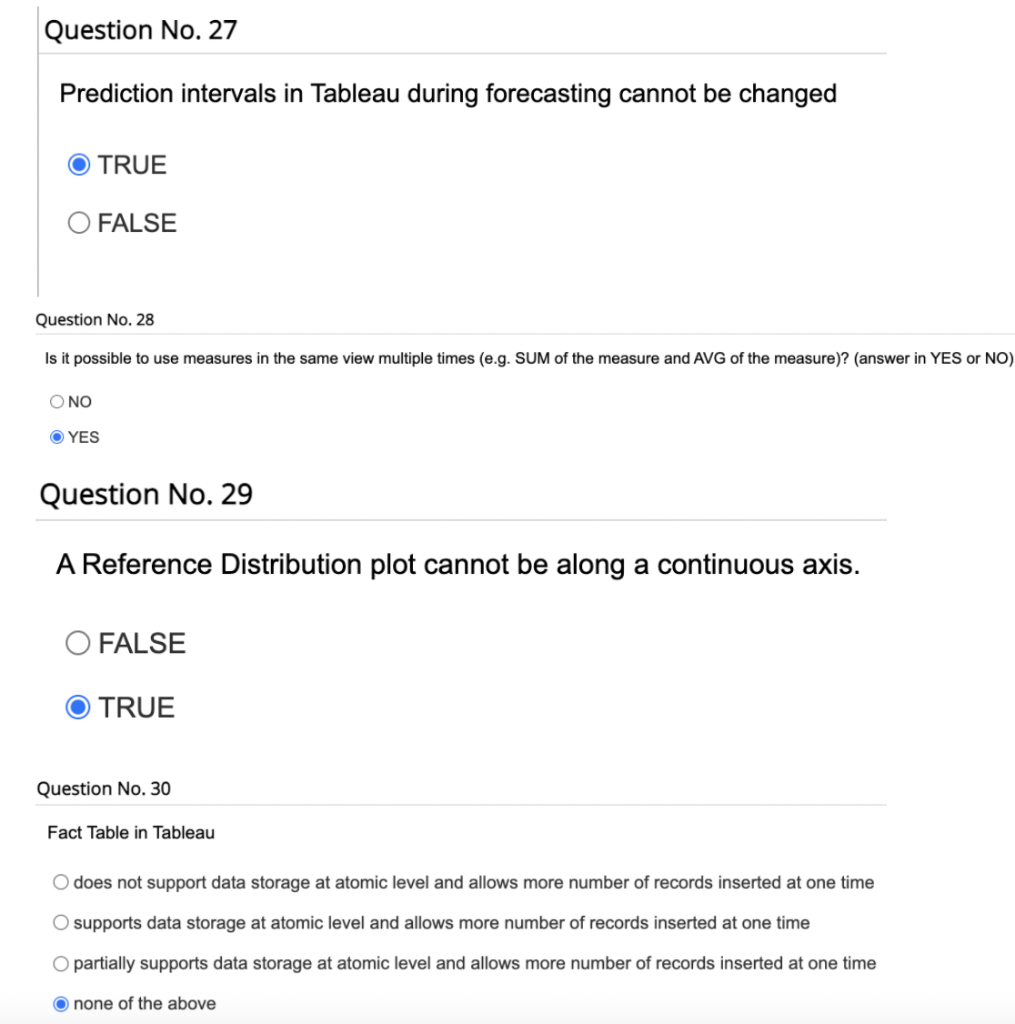
Question No. 1 Parameters do not allow users to insert their values, which can be integers, float, date, string that can be used to perform calculations FALSE O TRUE Question No. 2 By definition, Tableau displays measures over time as a O Bar O Histogram O Scatter Plots Line Question No. 3 Sets can be created on Measures. FALSE TRUE Question No. 4 A sheet cannot be used within a story directly. Either sheets should be used within a dashboard or a dashboard should be used within a story O TRUE FALSE Question No. 5 A good reason to use a bullet graph. O Displaying the sales growth for a particular year O Analyzing the trend for a time period Adding data to bins and calculating count measure O Comparing the actual against the target sales Question No. 6 Different Tableau files include the following O none of the above O Data Extraction Files, packaged workbooks worksheets, data connection files workbooks, bookmarks, packaged workbooks, data Extraction files, Data connection files Question No. 7 we can have multiple selection for parameters O NO YES Question No. 8 How do you create a Dashboard in Tableau? O all of these Dashboard Menu>New Dashboard>from Dashboard Tab drag sheet onto the Dashboard sheet area Task Bar>New Dashboard>from Layout tab drag sheet onto the Dashboard sheet area O Task Bar>New Dashboard>from Dashboard Tab drag sheet onto the Dashboard sheet area Question No. 9 How do you change the visual summary type to a pie chart type? Toolbar > Show Me button > Select Pie Chart O right-click the visual summary> select pie chart Worksheet Menu > Type > select pie chart Data Menu > Type> select pie chart Question No. 10 Joining requires two completely defined data sources in your report whereas Blending is used when you are combining data from same source, e.g. worksheets in an excel file TRUE O FALSE Question No. 11 Dual axis helps users view two scales of two measures in the same graph- State 'TRUE OR 'FALSE TRUE O FALSE Question No. 12 In the Data Pane, you can choose "Group by Folders" or "Group Data Source Table" TRUE FALSE Question No. 13 In the Data Pane, what sections do you have? Dimensions, Facts, sets and Parameters O Dimensions, Calculations, sets and Parameters Dimensions, measures, sets and Parameters O Dimensions, measures, groups, sets and Parameters Question No. 14 Data Blending in Tableau is not possible FALSE TRUE Question No. 15 Which of the descriptions below describes a Tableau Story O A collection of views from multiple worksheets contains a sequence of worksheets or dashboards that work together to convey information OA single view along with shelves,cards, legends, and the data and Analytics panes in its side bar Question No. 16 Choose the correct option of different filters in Tableau O Quick Filter, Comprehensive Filter, Ordinal Filter O Quick Filter, simple Filter, normal Filter Quick Filter, Context Filter, Ordinal Filter O Quick Filter, Context Filter, Normal Filter Question No. 17 The icon associated with the field that has been grouped is a Hash Equal To Paper Clip Set Question No. 18 Geocoding cannot be done in Tableau TRUE FALSE Question No. 19 Maximum no of tables that can be joined in tableau 24 32 28 O 30 Question No. 20 A Tableau Workbook can contain multiple data sources from different source systems? FALSE TRUE Question No. 21 .twbx workbook contain data along with all information present in dashboard whereas .twb comprises only all the information present in each dashboard O FALSE OTRUE Question No. 22 Different Products Tableau provide O all of these O Tableau Reader Tableau Server O Tableau Public O Tableau Desktop Question No. 23 Tableau 2019.x requires that you create a O parameter; join O parameter; calculated field O calculated field; filter and a to display a single State across two separate databases. Question No. 24 How do you edit the axes of your visualization? O Data tab > Marks card > Detail > Axis O Data tab > Marks card > Label O right-click anywhere on the visualization > Edit Axis O right-click the axis > Edit Axis Question No. 25 To O pivot stack your data, is to transform from a text table or crosstab to a data list? Ounpivot O categorize Question No. 26 Disaggregation returns all records in the underlying data source. FALSE O TRUE Question No. 27 Prediction intervals in Tableau during forecasting cannot be changed O TRUE FALSE Question No. 28 Is it possible to use measures in the same view multiple times (e.g. SUM of the measure and AVG of the measure)? (answer in YES or NO) O NO YES Question No. 29 A Reference Distribution plot cannot be along a continuous axis. O FALSE TRUE Question No. 30 Fact Table in Tableau O does not support data storage at atomic level and allows more number of records inserted at one time O supports data storage at atomic level and allows more number of records inserted at one time O partially supports data storage at atomic level and allows more number of records inserted at one time Onone of the above Question No. 1 Parameters do not allow users to insert their values, which can be integers, float, date, string that can be used to perform calculations FALSE O TRUE Question No. 2 By definition, Tableau displays measures over time as a O Bar O Histogram O Scatter Plots Line Question No. 3 Sets can be created on Measures. FALSE TRUE Question No. 4 A sheet cannot be used within a story directly. Either sheets should be used within a dashboard or a dashboard should be used within a story O TRUE FALSE Question No. 5 A good reason to use a bullet graph. O Displaying the sales growth for a particular year O Analyzing the trend for a time period Adding data to bins and calculating count measure O Comparing the actual against the target sales Question No. 6 Different Tableau files include the following O none of the above O Data Extraction Files, packaged workbooks worksheets, data connection files workbooks, bookmarks, packaged workbooks, data Extraction files, Data connection files Question No. 7 we can have multiple selection for parameters O NO YES Question No. 8 How do you create a Dashboard in Tableau? O all of these Dashboard Menu>New Dashboard>from Dashboard Tab drag sheet onto the Dashboard sheet area Task Bar>New Dashboard>from Layout tab drag sheet onto the Dashboard sheet area O Task Bar>New Dashboard>from Dashboard Tab drag sheet onto the Dashboard sheet area Question No. 9 How do you change the visual summary type to a pie chart type? Toolbar > Show Me button > Select Pie Chart O right-click the visual summary> select pie chart Worksheet Menu > Type > select pie chart Data Menu > Type> select pie chart Question No. 10 Joining requires two completely defined data sources in your report whereas Blending is used when you are combining data from same source, e.g. worksheets in an excel file TRUE O FALSE Question No. 11 Dual axis helps users view two scales of two measures in the same graph- State 'TRUE OR 'FALSE TRUE O FALSE Question No. 12 In the Data Pane, you can choose "Group by Folders" or "Group Data Source Table" TRUE FALSE Question No. 13 In the Data Pane, what sections do you have? Dimensions, Facts, sets and Parameters O Dimensions, Calculations, sets and Parameters Dimensions, measures, sets and Parameters O Dimensions, measures, groups, sets and Parameters Question No. 14 Data Blending in Tableau is not possible FALSE TRUE Question No. 15 Which of the descriptions below describes a Tableau Story O A collection of views from multiple worksheets contains a sequence of worksheets or dashboards that work together to convey information OA single view along with shelves,cards, legends, and the data and Analytics panes in its side bar Question No. 16 Choose the correct option of different filters in Tableau O Quick Filter, Comprehensive Filter, Ordinal Filter O Quick Filter, simple Filter, normal Filter Quick Filter, Context Filter, Ordinal Filter O Quick Filter, Context Filter, Normal Filter Question No. 17 The icon associated with the field that has been grouped is a Hash Equal To Paper Clip Set Question No. 18 Geocoding cannot be done in Tableau TRUE FALSE Question No. 19 Maximum no of tables that can be joined in tableau 24 32 28 O 30 Question No. 20 A Tableau Workbook can contain multiple data sources from different source systems? FALSE TRUE Question No. 21 .twbx workbook contain data along with all information present in dashboard whereas .twb comprises only all the information present in each dashboard O FALSE OTRUE Question No. 22 Different Products Tableau provide O all of these O Tableau Reader Tableau Server O Tableau Public O Tableau Desktop Question No. 23 Tableau 2019.x requires that you create a O parameter; join O parameter; calculated field O calculated field; filter and a to display a single State across two separate databases. Question No. 24 How do you edit the axes of your visualization? O Data tab > Marks card > Detail > Axis O Data tab > Marks card > Label O right-click anywhere on the visualization > Edit Axis O right-click the axis > Edit Axis Question No. 25 To O pivot stack your data, is to transform from a text table or crosstab to a data list? Ounpivot O categorize Question No. 26 Disaggregation returns all records in the underlying data source. FALSE O TRUE Question No. 27 Prediction intervals in Tableau during forecasting cannot be changed O TRUE FALSE Question No. 28 Is it possible to use measures in the same view multiple times (e.g. SUM of the measure and AVG of the measure)? (answer in YES or NO) O NO YES Question No. 29 A Reference Distribution plot cannot be along a continuous axis. O FALSE TRUE Question No. 30 Fact Table in Tableau O does not support data storage at atomic level and allows more number of records inserted at one time O supports data storage at atomic level and allows more number of records inserted at one time O partially supports data storage at atomic level and allows more number of records inserted at one time Onone of the above
Step by Step Solution
3.44 Rating (154 Votes )
There are 3 Steps involved in it
The detailed answer for the above question is provided below 1 TRUE A parameter in programming allows a user to insert values into a program or function These values can be of different data types suc... View full answer

Get step-by-step solutions from verified subject matter experts