

Question: please answer all 6. What is the description of variable packpc? What is the sample average of it? What is the unit of it? Provide
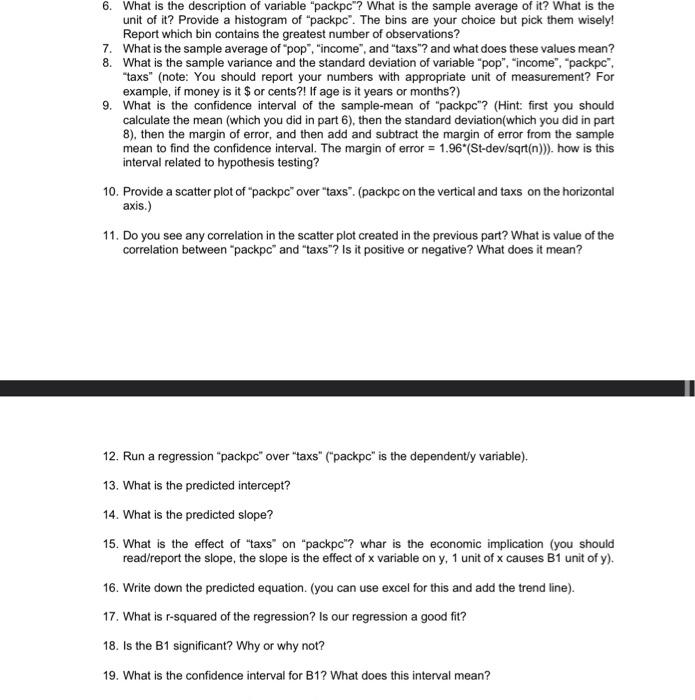
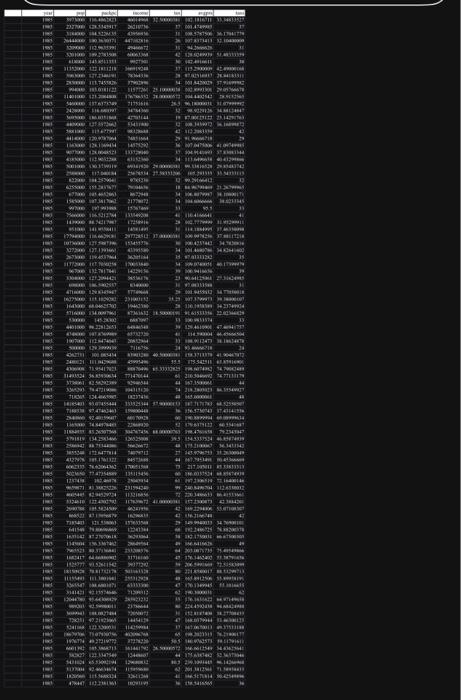
6. What is the description of variable "packpc"? What is the sample average of it? What is the unit of it? Provide a histogram of "packpc". The bins are your choice but pick them wisely! Report which bin contains the greatest number of observations? 7. What is the sample average of "pop", "income", and "taxs"? and what does these values mean? 8. What is the sample variance and the standard deviation of variable "pop", "income", "packpc", "taxs" (note: You should report your numbers with appropriate unit of measurement? For example, if money is it $ or cents?! If age is it years or months?) 9. What is the confidence interval of the sample-mean of "packpc"? (Hint: first you should calculate the mean (which you did in part 6), then the standard deviation(which you did in part 8), then the margin of error, and then add and subtract the margin of error from the sample mean to find the confidence interval. The margin of error =1.96( St-dev/sqrt(n)))). how is this interval related to hypothesis testing? 10. Provide a scatter plot of "packpc" over "taxs". (packpc on the vertical and taxs on the horizontal axis.) 11. Do you see any correlation in the scatter plot created in the previous part? What is value of the correlation between "packpc" and "taxs"? Is it positive or negative? What does it mean? 12. Run a regression "packpc" over "taxs" ("packpc" is the dependent/y variable). 13. What is the predicted intercept? 14. What is the predicted slope? 15. What is the effect of "taxs" on "packpc"? whar is the economic implication (you should read/report the slope, the slope is the effect of x variable on y,1 unit of x causes B1 unit of y ). 16. Write down the predicted equation. (you can use excel for this and add the trend line). 17. What is r-squared of the regression? Is our regression a good fit? 18. Is the B1 significant? Why or why not? 19. What is the confidence interval for B1 ? What does this interval mean? 6. What is the description of variable "packpc"? What is the sample average of it? What is the unit of it? Provide a histogram of "packpc". The bins are your choice but pick them wisely! Report which bin contains the greatest number of observations? 7. What is the sample average of "pop", "income", and "taxs"? and what does these values mean? 8. What is the sample variance and the standard deviation of variable "pop", "income", "packpc", "taxs" (note: You should report your numbers with appropriate unit of measurement? For example, if money is it $ or cents?! If age is it years or months?) 9. What is the confidence interval of the sample-mean of "packpc"? (Hint: first you should calculate the mean (which you did in part 6), then the standard deviation(which you did in part 8), then the margin of error, and then add and subtract the margin of error from the sample mean to find the confidence interval. The margin of error =1.96( St-dev/sqrt(n)))). how is this interval related to hypothesis testing? 10. Provide a scatter plot of "packpc" over "taxs". (packpc on the vertical and taxs on the horizontal axis.) 11. Do you see any correlation in the scatter plot created in the previous part? What is value of the correlation between "packpc" and "taxs"? Is it positive or negative? What does it mean? 12. Run a regression "packpc" over "taxs" ("packpc" is the dependent/y variable). 13. What is the predicted intercept? 14. What is the predicted slope? 15. What is the effect of "taxs" on "packpc"? whar is the economic implication (you should read/report the slope, the slope is the effect of x variable on y,1 unit of x causes B1 unit of y ). 16. Write down the predicted equation. (you can use excel for this and add the trend line). 17. What is r-squared of the regression? Is our regression a good fit? 18. Is the B1 significant? Why or why not? 19. What is the confidence interval for B1 ? What does this interval mean
Step by Step Solution
There are 3 Steps involved in it

Get step-by-step solutions from verified subject matter experts