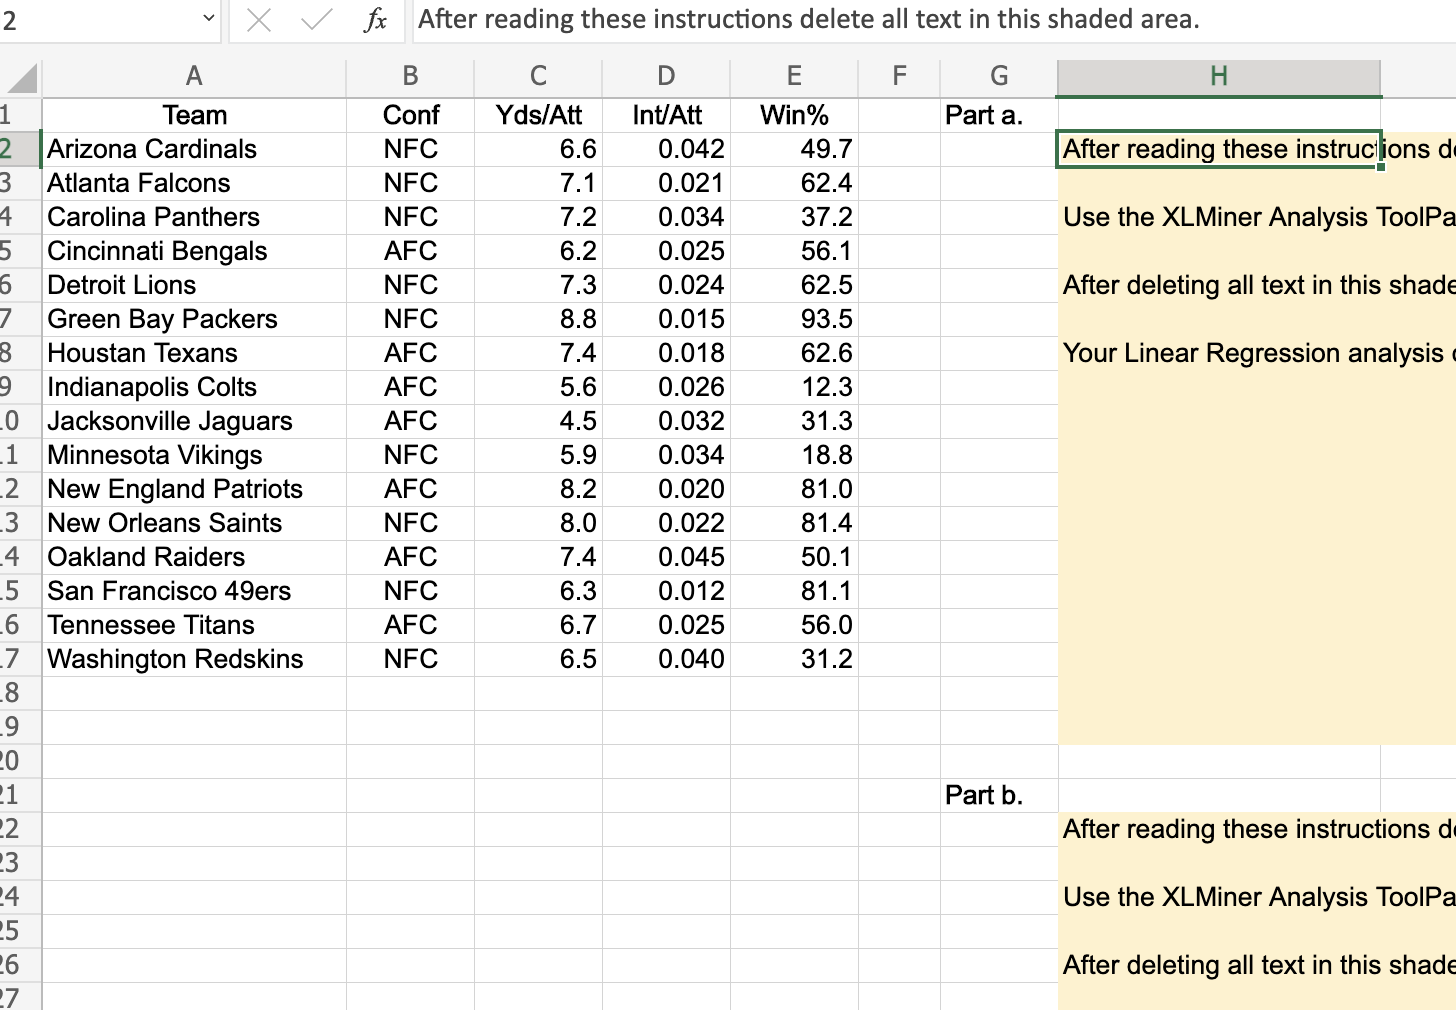
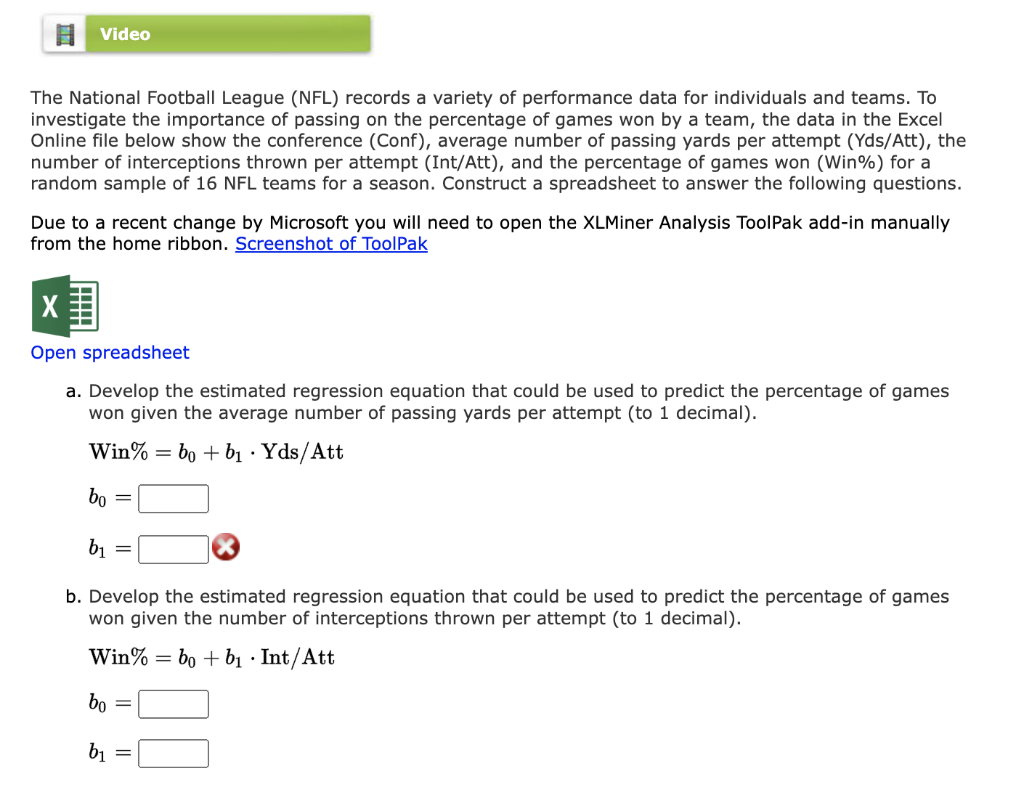
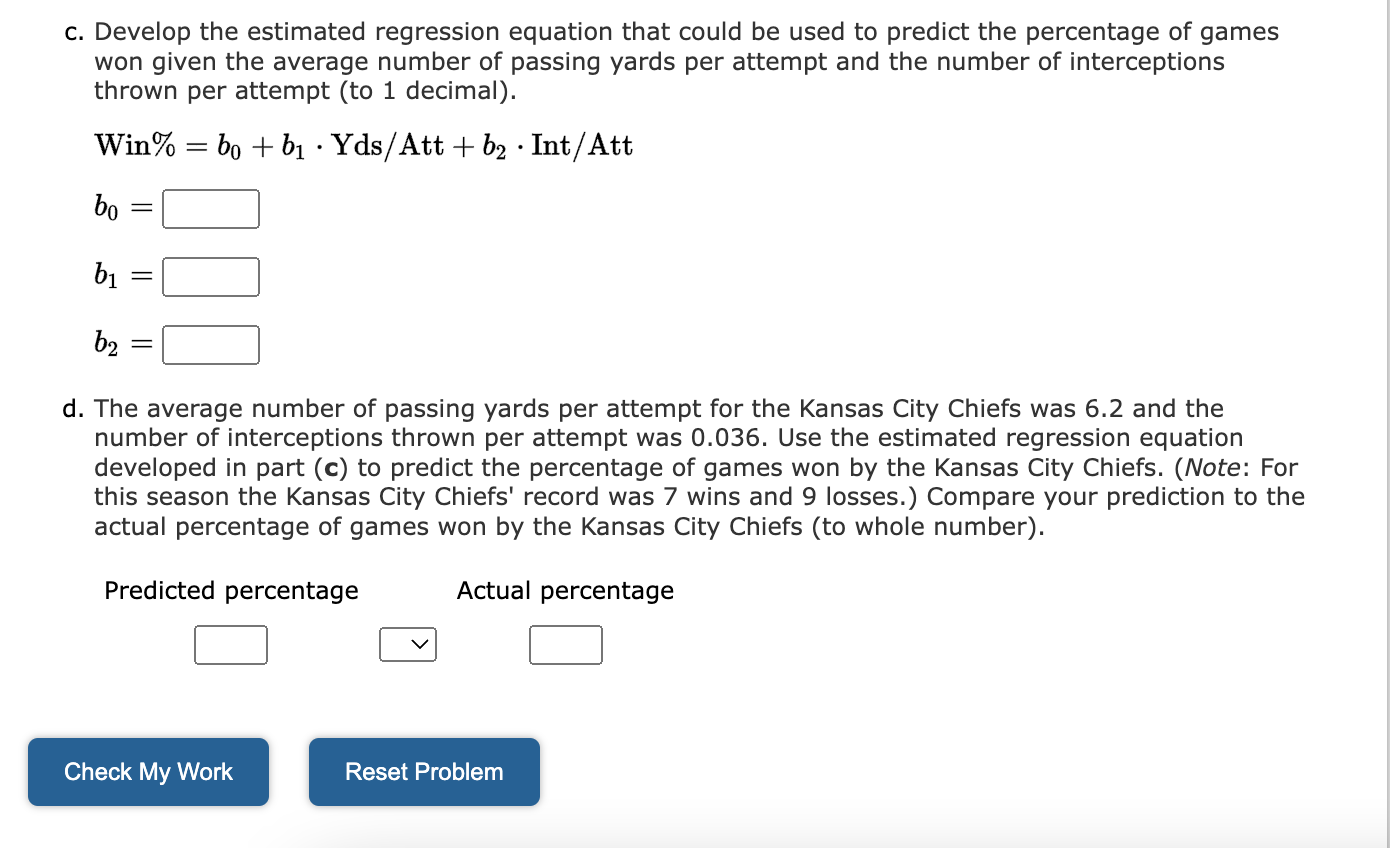
Question: PLEASE ANSWER ALL, all data is provided H After reading these instrucilions d Use the XLMiner Analysis ToolPa After deleting all text in this shade

PLEASE ANSWER ALL, all data is provided

PLEASE ANSWER ALL, all data is provided H AfterPLEASE ANSWER ALL, all data is provided H AfterPLEASE ANSWER ALL, all data is provided H After

H After reading these instrucilions d Use the XLMiner Analysis ToolPa After deleting all text in this shade Your Linear Regression analysis After reading these instructions d Use the XLMiner Analysis ToolPa After deleting all text in this shade The National Football League (NFL) records a variety of performance data for individuals and teams. To investigate the importance of passing on the percentage of games won by a team, the data in the Excel Online file below show the conference (Conf), average number of passing yards per attempt (Yds/Att), the number of interceptions thrown per attempt (Int/Att), and the percentage of games won (Win\%) for a random sample of 16 NFL teams for a season. Construct a spreadsheet to answer the following questions. Due to a recent change by Microsoft you will need to open the XLMiner Analysis ToolPak add-in manually from the home ribbon. Screenshot of ToolPak Open spreadsheet a. Develop the estimated regression equation that could be used to predict the percentage of games won given the average number of passing yards per attempt (to 1 decimal). Win%=b0+b1Yds/Attb0=b1= b. Develop the estimated regression equation that could be used to predict the percentage of games won given the number of interceptions thrown per attempt (to 1 decimal). Win%=b0+b1Int/Att c. Develop the estimated regression equation that could be used to predict the percentage of games won given the average number of passing yards per attempt and the number of interceptions thrown per attempt (to 1 decimal). Win%=b0+b1Yds/Att+b2Int/Attb0=b1=b2= d. The average number of passing yards per attempt for the Kansas City Chiefs was 6.2 and the number of interceptions thrown per attempt was 0.036. Use the estimated regression equation developed in part (c) to predict the percentage of games won by the Kansas City Chiefs. (Note: For this season the Kansas City Chiefs' record was 7 wins and 9 losses.) Compare your prediction to the actual percentage of games won by the Kansas City Chiefs (to whole number). H After reading these instrucilions d Use the XLMiner Analysis ToolPa After deleting all text in this shade Your Linear Regression analysis After reading these instructions d Use the XLMiner Analysis ToolPa After deleting all text in this shade The National Football League (NFL) records a variety of performance data for individuals and teams. To investigate the importance of passing on the percentage of games won by a team, the data in the Excel Online file below show the conference (Conf), average number of passing yards per attempt (Yds/Att), the number of interceptions thrown per attempt (Int/Att), and the percentage of games won (Win\%) for a random sample of 16 NFL teams for a season. Construct a spreadsheet to answer the following questions. Due to a recent change by Microsoft you will need to open the XLMiner Analysis ToolPak add-in manually from the home ribbon. Screenshot of ToolPak Open spreadsheet a. Develop the estimated regression equation that could be used to predict the percentage of games won given the average number of passing yards per attempt (to 1 decimal). Win%=b0+b1Yds/Attb0=b1= b. Develop the estimated regression equation that could be used to predict the percentage of games won given the number of interceptions thrown per attempt (to 1 decimal). Win%=b0+b1Int/Att c. Develop the estimated regression equation that could be used to predict the percentage of games won given the average number of passing yards per attempt and the number of interceptions thrown per attempt (to 1 decimal). Win%=b0+b1Yds/Att+b2Int/Attb0=b1=b2= d. The average number of passing yards per attempt for the Kansas City Chiefs was 6.2 and the number of interceptions thrown per attempt was 0.036. Use the estimated regression equation developed in part (c) to predict the percentage of games won by the Kansas City Chiefs. (Note: For this season the Kansas City Chiefs' record was 7 wins and 9 losses.) Compare your prediction to the actual percentage of games won by the Kansas City Chiefs (to whole number)

Step by Step Solution

There are 3 Steps involved in it

1 Expert Approved Answer
Step: 1 Unlock blur-text-image
Question Has Been Solved by an Expert!

Get step-by-step solutions from verified subject matter experts

Step: 2 Unlock
Step: 3 Unlock

Students Have Also Explored These Related General Management Questions!