

Question: please answer all and provide formulas and how you found it What is Nike's times interest earned for the period ending May 31, 2019? 40.37

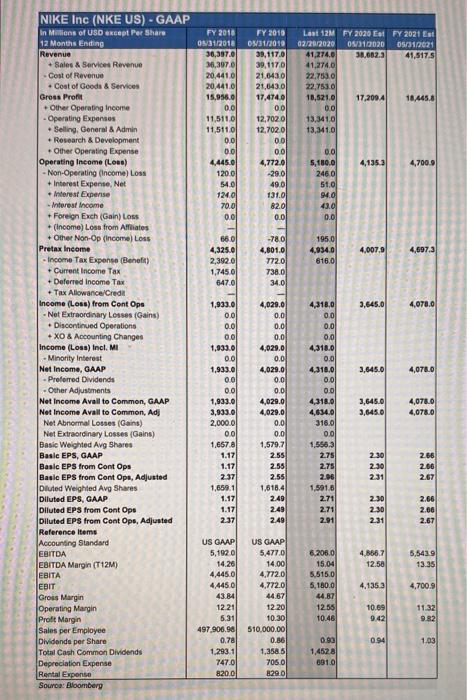
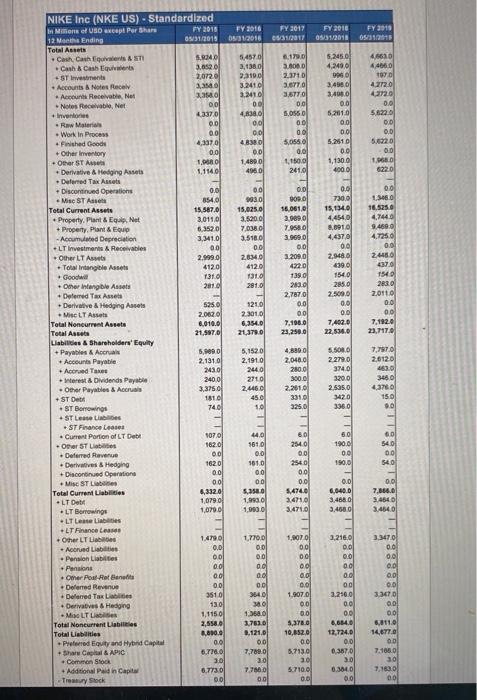
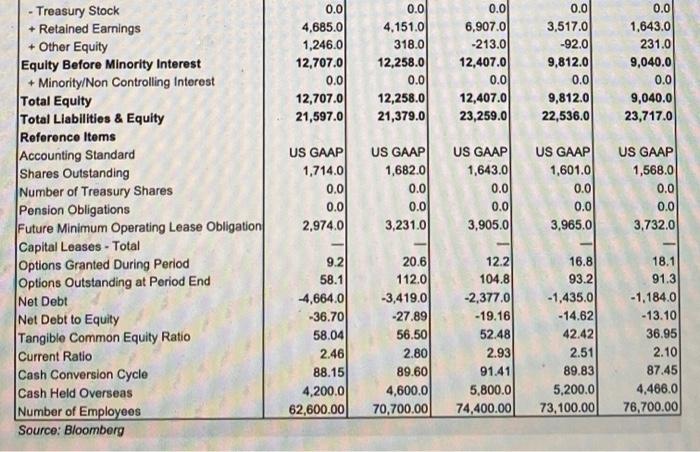
What is Nike's times interest earned for the period ending May 31, 2019? 40.37 10.46 O 36.43 26.83 38.54 What is Nike's operating profit margin for the period ending May 31, 2019? O 12.20% O 10.44% O 75.17% O 12.98% O 44.11% What is Nike's total asset turnover for the period ending May 31, 2019? O 1.65 O 1.78 O 0.19 O 5.20 O 5.67 What is Nike's inventory turnover for the period ending May 31, 2019? O 3.85 O 3.98 O 9.41 05.01 O 3.79 FY 2018 09/31/2018 30,397.0 36,3970 20,4410 20,4410 15,956.0 0.0 11,511.0 11,5110 0.0 00 4,445.0 1200 540 1240 70.0 0.0 FY 2010 03/31/2010 39,117.0 39,1170 21.643.0 21.043.0 17.4740 00 12,7020 12,70201 0.0 00 4,7720 29.0 Last 12M FY 2020 El FY 2021 Est 02/29/2020 05/3102020 DSC312021 41,2740 38,082.3 41,517.5 41.274.0 22.753.0 22,753.0 18,521.0 17,2094 18.445.8 00 13,3410 13,341.0 4,1353 4,700.9 490 00 5,180.0 2460 51.0 94.0 43.0 0.0 131.0 B2.0 0.01 2007 1950 4,934.0 816.0 4,007,0 660 4,325.0 2,392.0 1,7450 647.0 4,697.3 -780 4,801.0 772.0 738.0 34.0) 3,645.0 40700 4,070.0 NIKE Inc (NKE US) - GAAP in Millions of USD except Per Share 12 Months Ending Revenue + Sales & Services Revenue Cost of Revenue *Coat of Goods & Services Gross Pront Other Operating Incore Operating Expenses -Selling, General & Admin +Research & Development + Other Operating Expense Operating Income (Loss) - Non-Operating (Income) Loss +Interest Expense, Net Interest Expense Interest Income Foreign Exch(Gain) Los +(Income) Lose from Affiliates + Other Non-Op (income) Loss Pretax Income - Income Tax Expense (Benefit) + Current Income Tax +Deferred Income Tax + Tax Allowance/Credit Income (Loss) from Cont Ops -Net Extraordinary Losses (Gains) + Discontinued Operations +XO & Accounting Changes Income (Loss) Incl. MI Minority Interest Net Income, GAAP - Preferred Dividends Other Adjustments Net Income Avell to Common, GAAP Net Income Avall to Commen, Adj Net Abnormal Losses (Gains) Net Extraordinary Losses (Gains) Basic Weighted Avg Shares Basic EPS, GAAP Basic EPS from Cont Ops Basic EPS from Cont Ops, Adjusted Diluted Weighted Avg Shares Diluted EPS, GAAP Diluted EPS from Cont Ops Diluted EPS from Cont Ope, Adjusted Reference Items Accounting Standard EBITDA EBITDA Margin (T12M) EBITA EBIT Gross Margin Operating Margin Proft Margin Sales per Employee Dividende per Share Total Cash Common Dividends Depreciation Expense Rental Expense Souro: Bloomberg 3,645.0 4,078.0 1,933.0 0.0 0.0 0.0 1,933.0 0.0 1,933.0 0.0 0.0 1,933.0 3,933.0 2,000.0 0.0 1,6578 1.17 1.17 2.37 1,658.1 1.17 1.17 2.37 4,020.0 0.0 0.0 0.0 4,029,0 0.0 4,029.0 0.0 0.0 4,029.0 4,029.0 0.0 0.0 1,579.7 2.55 2.55 2.55 1,618.4 2.49 2.49 249 4,318,0 0.0 0.0 0.0 4,318.0 0.0 4.316.0 0.01 0.0 4.316.0 4,634.0 316.0 0.0 1,5563 2.75 2.75 2.96 1,591.6 2.71 2.71 2.91 3,645.0 3,645.0 4,0780 4,078.0 2.30 2.30 2.31 2.66 2.06 2.67 2.30 230 2.31 2.66 2.06 2.67 4,866.7 12.50 5,5439 13.35 4.135.2 US GAAPI 5,1920 14.20 4,445.0 4,445.0 43.84 12.21 6.31 497.906.96 0.78 1.293.1 747.0 820.0 6.206.0 15.04 5.515.0 5,180.0 44.87 1255 10.46 4,700.9 US GAAP 5,477.00 14.00 4,772.0 4,772.0 44.67 12.20 10.30 510,000.00 0.86 1,358.5 7050 8290 10.69 9.42 11.32 9.82 0.94 1.03 0.90 1.4528 191.0 FY 2016 031/2016 FY 2017 1/31011 FY 2016 05/31/2010 FY2018 07311 5,2450 4,240.0 350 5,4570 3,1380 221001 3.2410 3.210 00 430 00 00 4.8.38.00 OD 1.480.0 4960 10 3.600.0 2010 3.6770 3,5TTO 0.0 5,0560 00 00 5056 0.6 1,100 2010 2.4960 340.0 0.01 5.2010 00 0.01 5.2010 0.0 1,1300 4000 4660 44000 TOYO 2720 4,2720 0.0 5.6220 0.0 0.0 58220 00 1.9680 6220 00 9930 15,025.00 3.5200 7.0360 3.5180 0.0 2.6340 4120 1310 281.0 - 1210 23010 6.354.0 27.0 0.0 BOD. 16.061.0 3.989.0 7.958.0 3.9690 0.0 3.200.0 4220 139.0 283.0 2,7870 0.0 00 7.1960 23,250.0 0.0 7300 15,134.0 44540 8,0910 44370 00 2.948.6 4390 1540 285.0 2.500.0 0.0 0.0 7,402.01 22.534.0 00 1.5480 16.5250 4,7440 9.460.0 4.7250 0.0 2486 4370 1540 2830 2011 0.0 00 7,1920 23,7170 NIKE Inc (NKE US) - Standardized in Millions of USD except Per Share FY 2016 12 Months Ending 05/31/2015 Total Assets Cash Casques & STI 5.8040 Cash & Cashqi 3.6520 + ST Investments 2,0720 Accounts & Notes fecely Account Receivable Net 335.0 Notes Receivab, Net 00 Invention 3370 - Raw Materia 00 Work in Process 0.0 Finished Goods 4,3370 Other Inventory 0.0 - OSTA 1. Derivative & Hedging Assets 1,1140 Deferred Tax Assets + Discontinued Operations 0.0 Mit ST Assets 8540 Total Current Assets 15.587.0 Property. Plant & Eq.Net 3.0110 + Property Plant & EU 6.35201 - Accumulated Depreciation 3,341.0 +LT Investments & Receivables 00 Other LT Aws 2.999.0 Tonstangible Assets 4120 . Good 1310 Other Infangbile Assets 2016 Deferred Tax Asset Derivative & Hedging Assets 525.01 - Misc LT Assets 2.002.01 Total Noncurrent Assets 0.010.0 Total Assets 21.5STD Liabides & Shareholders' Equity + Payables & Accra 5.000.0 + Accounts Payable 2.131.0 Acred Taxes 243.00 Interest & Dividends Payable 2400 - Other Payables & Accu 3.375.0 + ST Det 1810 ST Borrowings 740 ST LLI +ST Finance Lease . Current Portion of LTD 1070 - OM STU 162.0 Deferred Revenue 00 Derivatives & Hedging 1620 + Discontinued Operation 00 Misc STL 00 Total Current Labs 6.3120 + LT Date 1,0790 .LT Brawings 1,0700 - LT Leste Labs +LT Finance Leads +Other LTL 1.479 Abrud Liabi 0.0 Pension Lists 00 Pensions 0.0 Omer Poule Balita 00 -Deferred Revenge 00 Deferred Tax 3510 Derves & Hedging 130 Miso LT Les 1,1150 Total Noncurrent Liabilities 2,658.0 Total abilities 2010.0 Preferred Equity and Hybrid Capital 0.0 har Cell & APIC 6.770 Commons 30 + Additional Paldin Capital 6.7730 Trey Stock 0.0 5,1520 2.1910 2440 2710 2.4460 45.0 1.0 4,880 0 2,048.0 2800 300.0 2.261.0 3310 325.0 5.500.0 2.2790 3740 320.00 2.535.0 3420 3360 7,7970 2012.0 4630 3460 43780 150 00 50 190.0 0.0 190.0 60 54.0 00 540 44.0 1610 0.0 1610 00 00 350 1.993.0 1,003 60 2540 00 2540 00 0.0 5,4740 2.4710 3.4710 0.0 6.040.0 3.4680 3.4560 0.0 7.864.0 3.4540 3.4540 177001 00 00 0.0 00 0.01 3540 380 10 1.7610 0.121.01 00 7.7890 30 1,9070 00 00 od 0.0 0.00 1.8070 0.0 0.00 5.3.0 10.052.0 00 5.7130 30 5.7100 0.0 3.210.0 0.0 0.0 00 0.0 00 3.210.0 0.0 0.0 6,664.0 12,724.0 00 0.3870 30 0.3640 0.0 3.3470 0.0 0.0 0.0 0.0 00 110 00 00 8.811.0 14.6770 OD 7.165.0 30 7,1630 00 7.7860 00 0.0 4,685.0 1,246.0 12,707.0 0.0 12,707.0 21,597.0 0.0 4,151.0 318.0 12,258.0 0.0 12,258.0 21,379.0 0.0 6,907.0 -213.0 12,407.0 0.0 12,407.0 23,259.0 0.0 3.517.0 -92.0 9,812.0 0.0 9,812.00 22,536.0 0.0 1,643.0 231.0 9,040.0 0.0 9,040.0 23,717.01 - Treasury Stock + Retained Earnings + Other Equity Equity Before Minority Interest + Minority/Non Controlling Interest Total Equity Total Liabilities & Equity Reference Items Accounting Standard Shares Outstanding Number of Treasury Shares Pension Obligations Future Minimum Operating Lease Obligation Capital Leases - Total Options Granted During Period Options Outstanding at Period End Net Debt Net Debt to Equity Tangible Common Equity Ratio Current Ratio Cash Conversion Cycle Cash Held Overseas Number of Employees Source: Bloomberg US GAAP 1,714.0 0.0 0.0 2,974.00 US GAAP 1,682.0 0.0 0.0 3,231.0 US GAAP 1,643.0 0.0 0.0 3,905.01 US GAAP 1,601.0 0.0 0.0 3,965.0 US GAAP 1,568.0 0.0 0.0 3,732.0 16.8 92 58.1 4,664.0 -36.70 58.04 2.46 88.15 4,200.00 62,600.00 20.6 112.0 -3,419.00 -27.89 56.50 2.80 89.60 4,600.00 70,700.00 12.2. 104.8 -2,377.0 -19.16 52.48 2.93 91.41 5,800.00 74,400.00 93.2 -1,435.0 - 14.62 42.42 2.51 89.83 5,200.0 73,100.00 18.1 91.3 -1,184.0 -13.10 36.95 2.10 87.45 4,466.0 76,700.00
Step by Step Solution
There are 3 Steps involved in it

Get step-by-step solutions from verified subject matter experts