

Question: Please Answer All Flip Project Done Mark's Construction and Realty Mark's Construction and Realty buys and flips houses. They have hired you to look at
Please Answer All 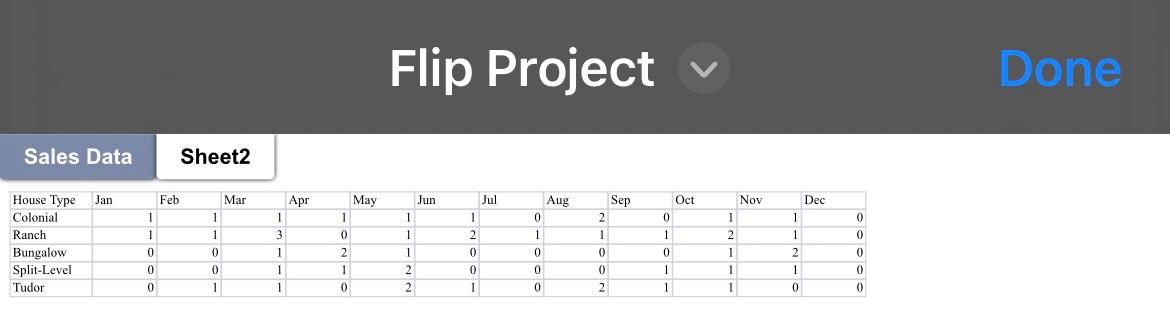
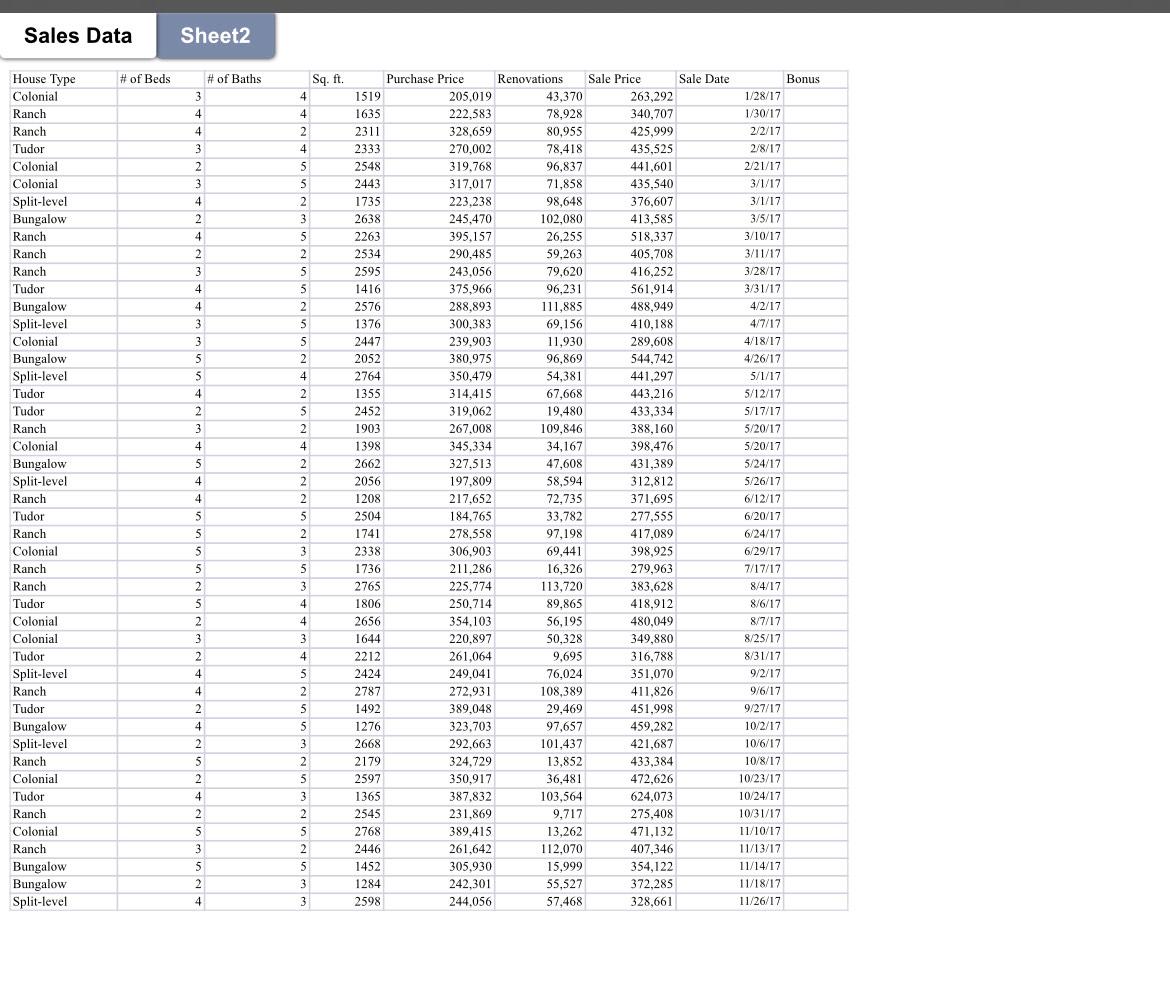
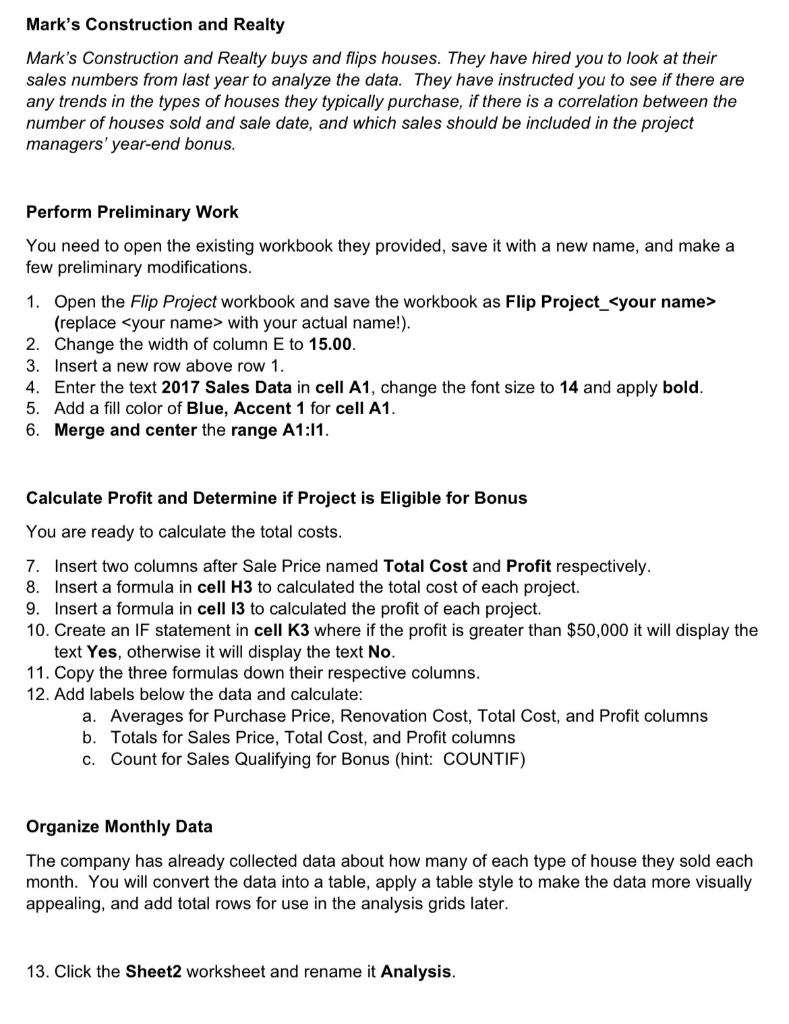
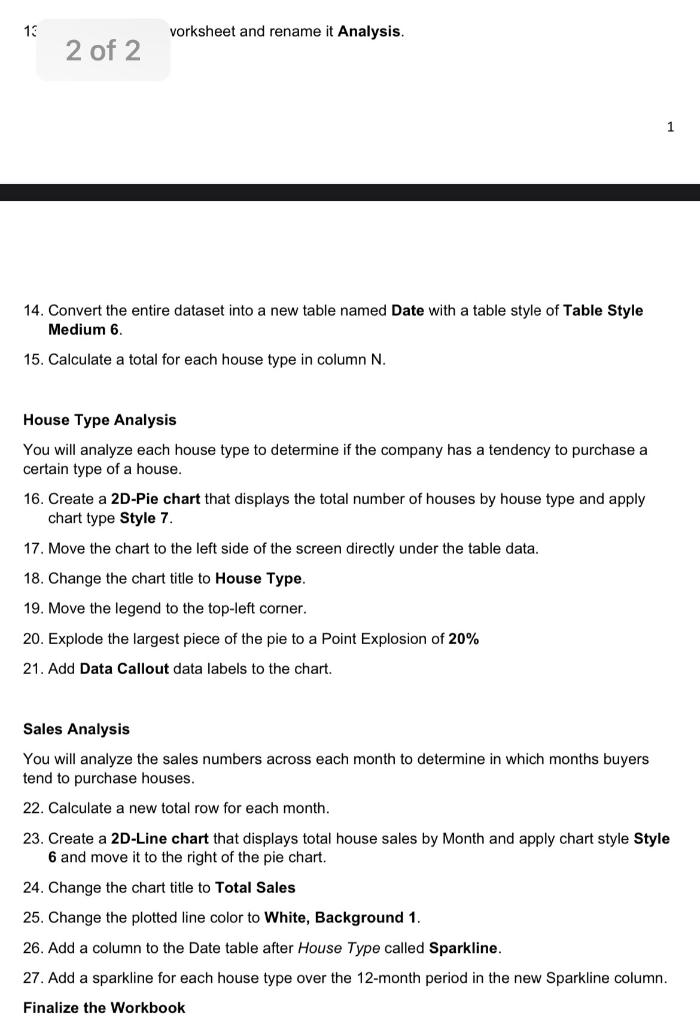
Flip Project Done Mark's Construction and Realty Mark's Construction and Realty buys and flips houses. They have hired you to look at their sales numbers from last year to analyze the data. They have instructed you to see if there are any trends in the types of houses they typically purchase, if there is a correlation between the number of houses sold and sale date, and which sales should be included in the project managers' year-end bonus. Perform Preliminary Work You need to open the existing workbook they provided, save it with a new name, and make a few preliminary modifications. 1. Open the Flip Project workbook and save the workbook as Flip Project_ (replace with your actual name!). 2. Change the width of column E to 15.00. 3. Insert a new row above row 1 . 4. Enter the text 2017 Sales Data in cell A1, change the font size to 14 and apply bold. 5. Add a fill color of Blue, Accent 1 for cell A1. 6. Merge and center the range A1:I1. Calculate Profit and Determine if Project is Eligible for Bonus You are ready to calculate the total costs. 7. Insert two columns after Sale Price named Total Cost and Profit respectively. 8. Insert a formula in cell H3 to calculated the total cost of each project. 9. Insert a formula in cell 13 to calculated the profit of each project. 10. Create an IF statement in cell K3 where if the profit is greater than $50,000 it will display the text Yes, otherwise it will display the text No. 11. Copy the three formulas down their respective columns. 12. Add labels below the data and calculate: a. Averages for Purchase Price, Renovation Cost, Total Cost, and Profit columns b. Totals for Sales Price, Total Cost, and Profit columns c. Count for Sales Qualifying for Bonus (hint: COUNTIF) Organize Monthly Data The company has already collected data about how many of each type of house they sold each month. You will convert the data into a table, apply a table style to make the data more visually appealing, and add total rows for use in the analysis grids later. 13. Click the Sheet2 worksheet and rename it Analysis. 1 vorksheet and rename it Analysis. 14. Convert the entire dataset into a new table named Date with a table style of Table Style Medium 6. 15. Calculate a total for each house type in column N. House Type Analysis You will analyze each house type to determine if the company has a tendency to purchase a certain type of a house. 16. Create a 2D-Pie chart that displays the total number of houses by house type and apply chart type Style 7. 17. Move the chart to the left side of the screen directly under the table data. 18. Change the chart title to House Type. 19. Move the legend to the top-left corner. 20. Explode the largest piece of the pie to a Point Explosion of 20% 21. Add Data Callout data labels to the chart. Sales Analysis You will analyze the sales numbers across each month to determine in which months buyers tend to purchase houses. 22. Calculate a new total row for each month. 23. Create a 2D-Line chart that displays total house sales by Month and apply chart style Style 6 and move it to the right of the pie chart. 24. Change the chart title to Total Sales 25. Change the plotted line color to White, Background 1. 26. Add a column to the Date table after House Type called Sparkline. 27. Add a sparkline for each house type over the 12-month period in the new Sparkline column. Finalize the Workbook Flip Project Done Mark's Construction and Realty Mark's Construction and Realty buys and flips houses. They have hired you to look at their sales numbers from last year to analyze the data. They have instructed you to see if there are any trends in the types of houses they typically purchase, if there is a correlation between the number of houses sold and sale date, and which sales should be included in the project managers' year-end bonus. Perform Preliminary Work You need to open the existing workbook they provided, save it with a new name, and make a few preliminary modifications. 1. Open the Flip Project workbook and save the workbook as Flip Project_ (replace with your actual name!). 2. Change the width of column E to 15.00. 3. Insert a new row above row 1 . 4. Enter the text 2017 Sales Data in cell A1, change the font size to 14 and apply bold. 5. Add a fill color of Blue, Accent 1 for cell A1. 6. Merge and center the range A1:I1. Calculate Profit and Determine if Project is Eligible for Bonus You are ready to calculate the total costs. 7. Insert two columns after Sale Price named Total Cost and Profit respectively. 8. Insert a formula in cell H3 to calculated the total cost of each project. 9. Insert a formula in cell 13 to calculated the profit of each project. 10. Create an IF statement in cell K3 where if the profit is greater than $50,000 it will display the text Yes, otherwise it will display the text No. 11. Copy the three formulas down their respective columns. 12. Add labels below the data and calculate: a. Averages for Purchase Price, Renovation Cost, Total Cost, and Profit columns b. Totals for Sales Price, Total Cost, and Profit columns c. Count for Sales Qualifying for Bonus (hint: COUNTIF) Organize Monthly Data The company has already collected data about how many of each type of house they sold each month. You will convert the data into a table, apply a table style to make the data more visually appealing, and add total rows for use in the analysis grids later. 13. Click the Sheet2 worksheet and rename it Analysis. 1 vorksheet and rename it Analysis. 14. Convert the entire dataset into a new table named Date with a table style of Table Style Medium 6. 15. Calculate a total for each house type in column N. House Type Analysis You will analyze each house type to determine if the company has a tendency to purchase a certain type of a house. 16. Create a 2D-Pie chart that displays the total number of houses by house type and apply chart type Style 7. 17. Move the chart to the left side of the screen directly under the table data. 18. Change the chart title to House Type. 19. Move the legend to the top-left corner. 20. Explode the largest piece of the pie to a Point Explosion of 20% 21. Add Data Callout data labels to the chart. Sales Analysis You will analyze the sales numbers across each month to determine in which months buyers tend to purchase houses. 22. Calculate a new total row for each month. 23. Create a 2D-Line chart that displays total house sales by Month and apply chart style Style 6 and move it to the right of the pie chart. 24. Change the chart title to Total Sales 25. Change the plotted line color to White, Background 1. 26. Add a column to the Date table after House Type called Sparkline. 27. Add a sparkline for each house type over the 12-month period in the new Sparkline column. Finalize the Workbook
Step by Step Solution
There are 3 Steps involved in it

Get step-by-step solutions from verified subject matter experts