

Question: please answer all for a good rating and like!! Thanks :) look at the pictures excel based begin{tabular}{|r|r|r|r|} hline 42 & 2003 & 31.77 &
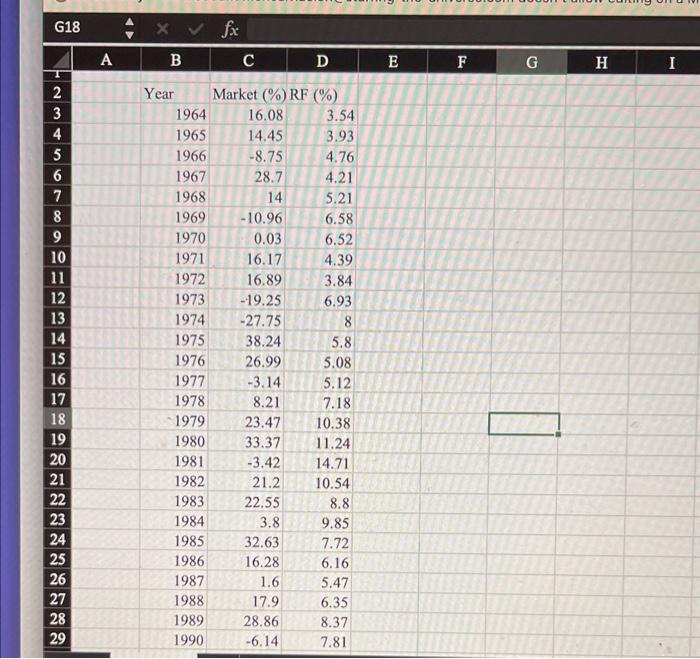
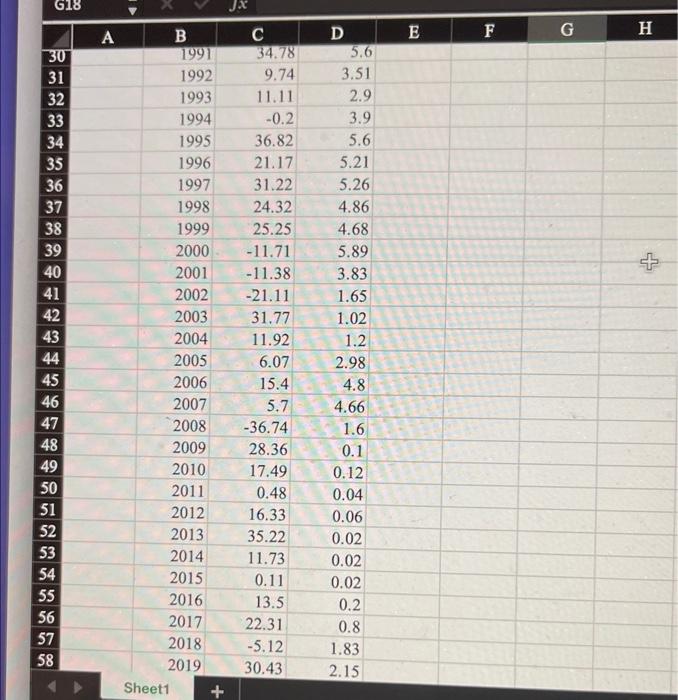
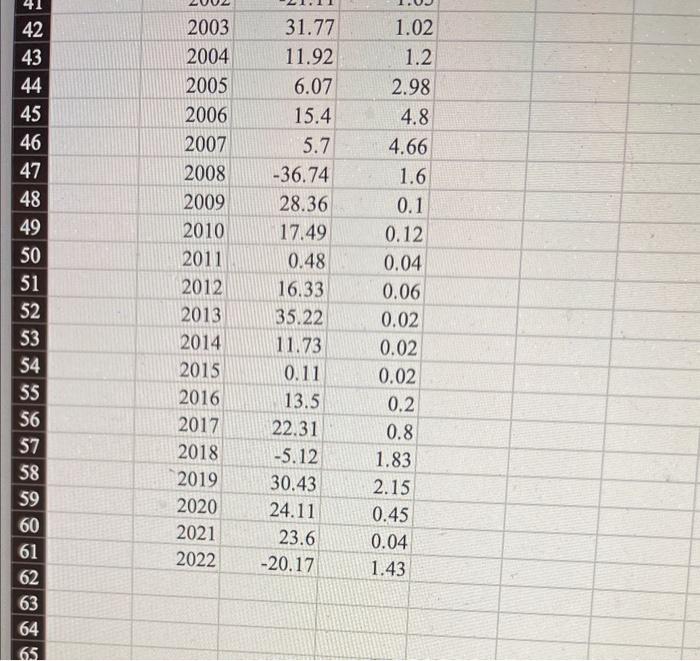
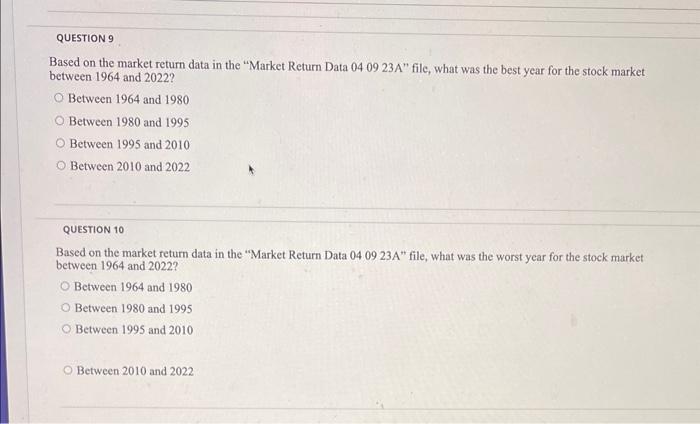
\begin{tabular}{|r|r|r|r|} \hline 42 & 2003 & 31.77 & 1.02 \\ \hline 43 & 2004 & 11.92 & 1.2 \\ \hline 44 & 2005 & 6.07 & 2.98 \\ \hline 45 & 2006 & 15.4 & 4.8 \\ \hline 46 & 2007 & 5.7 & 4.66 \\ \hline 47 & 2008 & -36.74 & 1.6 \\ \hline 48 & 2009 & 28.36 & 0.1 \\ \hline 49 & 2010 & 17.49 & 0.12 \\ \hline 50 & 2011 & 0.48 & 0.04 \\ \hline 51 & 2012 & 16.33 & 0.06 \\ \hline 52 & 2013 & 35.22 & 0.02 \\ \hline 53 & 2014 & 11.73 & 0.02 \\ \hline 54 & 2015 & 0.11 & 0.02 \\ \hline 55 & 2016 & 13.5 & 0.2 \\ \hline 56 & 2017 & 22.31 & 0.8 \\ \hline 57 & 2018 & -5.12 & 1.83 \\ \hline 58 & 2019 & 30.43 & 2.15 \\ \hline 59 & 2020 & 24.11 & 0.45 \\ \hline 60 & 2021 & 23.6 & 0.04 \\ \hline 61 & 2022 & -20.17 & 1.43 \\ \hline 62 & & & \\ \hline \end{tabular} Based on the market return data in the "Market Return Data 040923A filc, what was the best year for the stock market between 1964 and 2022 ? Between 1964 and 1980 Between 1980 and 1995 Between 1995 and 2010 Between 2010 and 2022 QUESTION 10 Based on the market return data in the "Market Return Data 040923A " file, what was the worst year for the stock market between 1964 and 2022 ? Between 1964 and 1980 Between 1980 and 1995 Between 1995 and 2010 Between 2010 and 2022 \begin{tabular}{|r|r|r|r|} \hline 42 & 2003 & 31.77 & 1.02 \\ \hline 43 & 2004 & 11.92 & 1.2 \\ \hline 44 & 2005 & 6.07 & 2.98 \\ \hline 45 & 2006 & 15.4 & 4.8 \\ \hline 46 & 2007 & 5.7 & 4.66 \\ \hline 47 & 2008 & -36.74 & 1.6 \\ \hline 48 & 2009 & 28.36 & 0.1 \\ \hline 49 & 2010 & 17.49 & 0.12 \\ \hline 50 & 2011 & 0.48 & 0.04 \\ \hline 51 & 2012 & 16.33 & 0.06 \\ \hline 52 & 2013 & 35.22 & 0.02 \\ \hline 53 & 2014 & 11.73 & 0.02 \\ \hline 54 & 2015 & 0.11 & 0.02 \\ \hline 55 & 2016 & 13.5 & 0.2 \\ \hline 56 & 2017 & 22.31 & 0.8 \\ \hline 57 & 2018 & -5.12 & 1.83 \\ \hline 58 & 2019 & 30.43 & 2.15 \\ \hline 59 & 2020 & 24.11 & 0.45 \\ \hline 60 & 2021 & 23.6 & 0.04 \\ \hline 61 & 2022 & -20.17 & 1.43 \\ \hline 62 & & & \\ \hline \end{tabular} Based on the market return data in the "Market Return Data 040923A filc, what was the best year for the stock market between 1964 and 2022 ? Between 1964 and 1980 Between 1980 and 1995 Between 1995 and 2010 Between 2010 and 2022 QUESTION 10 Based on the market return data in the "Market Return Data 040923A " file, what was the worst year for the stock market between 1964 and 2022 ? Between 1964 and 1980 Between 1980 and 1995 Between 1995 and 2010 Between 2010 and 2022
Step by Step Solution
There are 3 Steps involved in it

Get step-by-step solutions from verified subject matter experts