

Question: please answer all for Like, do what you can read Which Marks card option is only used to create pie charts? Topic: Showing Breakdowns of
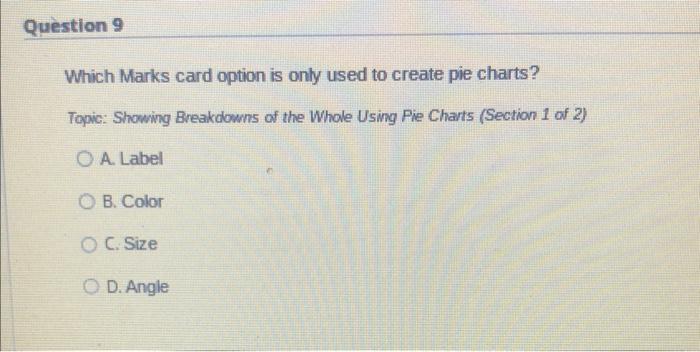
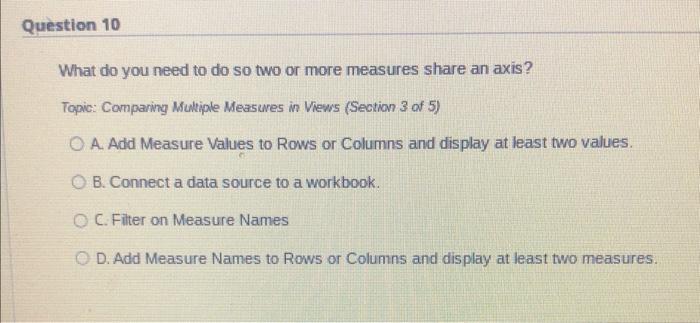
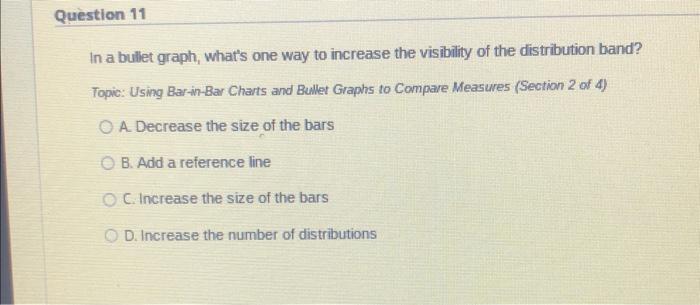
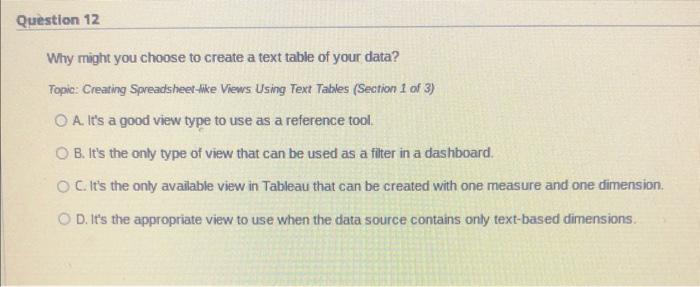
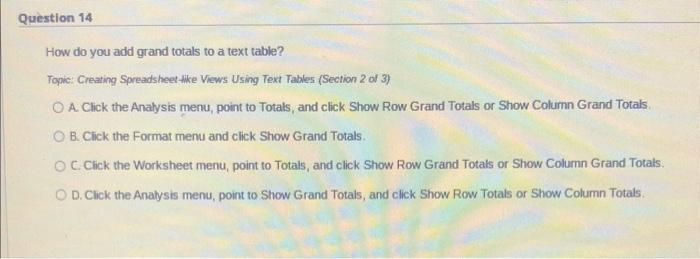
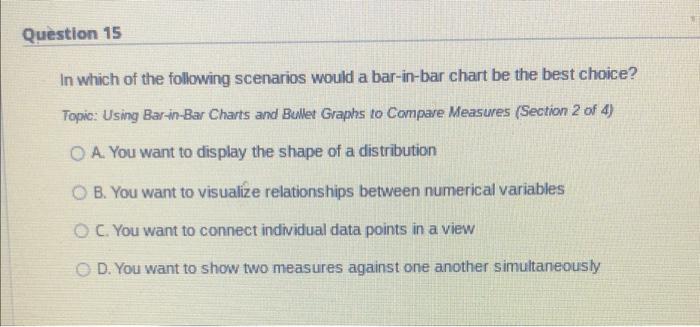
Which Marks card option is only used to create pie charts? Topic: Showing Breakdowns of the Whole Using Pie Charts (Section 1 of 2) A. Label B. Color C. Size D. Angle What do you need to do so two or more measures share an axis? Topic: Comparing Multiple Measures in Vews (Section 3 of 5) A. Add Measure Values to Rows or Columns and display at least two values. B. Connect a data source to a workbook. C. Filter on Measure Names D. Add Measure Names to Rows or Columns and display at least two measures. In a bullet graph, what's one way to increase the visibility of the distribution band? Topic: Using Bar-in-Bar Charts and Bullet Graphs to Compare Measures (Section 2 of 4) A. Decrease the size of the bars B. Add a reference line C. Increase the size of the bars D. Increase the number of distributions Why might you choose to create a text table of your data? Topic: Creating Spreadsheet-tike Views Using Text Tables (Section 1 of 3) A. It's a good view type to use as a reference tool. B. It's the only type of view that can be used as a fitter in a dashboard. C. It's the only available view in Tableau that can be created with one measure and one dimension. D. It's the appropriate view to use when the data source contains only text-based dimensions. How do you add grand totals to a text table? Topic: Creating Spreadsheet thke Views Using Text Tables (Section 2 of 3) A. Click the Analys is menu, point to Totals, and click Show Row Grand Totals or Show Column Grand Totals. B. Cick the Format menu and click Show Grand Totals. C. Click the Worksheet menu, point to Totals, and click Show Row Grand Totals or Show Column Grand Totats: D. Click the Analysis menu, point to Show Grand Totals, and click Show Row Totals or Show Column Totals. In which of the following scenarios would a bar-in-bar chart be the best choice? Topic: Using Bar-in-Bar Charts and Bullet Graphs to Compare Measures (Section 2 of 4) A. You want to display the shape of a distribution B. You want to visualize relationships between numerical variables C. You want to connect individual data points in a view D. You want to show two measures against one another simultaneously
Step by Step Solution
There are 3 Steps involved in it

Get step-by-step solutions from verified subject matter experts