

Question: please answer all four parts using R and please show how to create the least squares line in the program. Thank you 1.34 Enrollment in
 please answer all four parts using R and please show how to create the least squares line in the program. Thank you
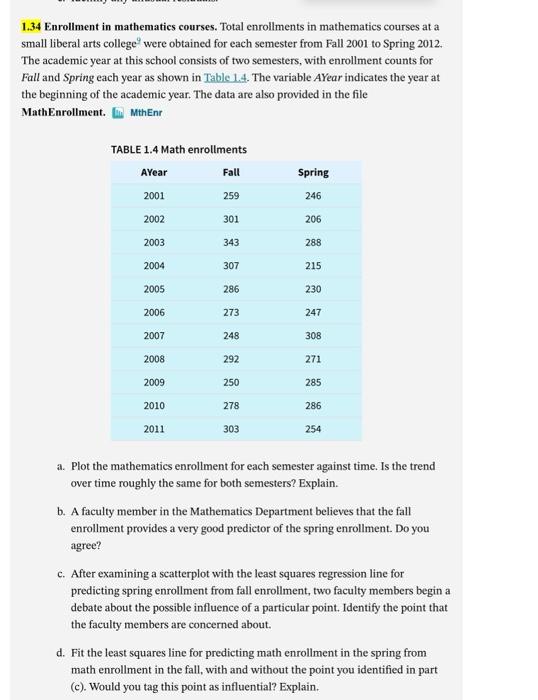
1.34 Enrollment in mathematics courses. Total enrollments in mathematics courses at a small liberal arts college 9 were obtained for each semester from Fall 2001 to Spring 2012. The academic year at this school consists of two semesters, with enrollment counts for Fall and Spring each year as shown in Table 1.4. The variable AYear indicates the year at the beginning of the academic year. The data are also provided in the file MathEnrollment. Liw MthEnr TABLE 1.4 Math enrollments a. Plot the mathematics enrollment for each semester against time. Is the trend over time roughly the same for both semesters? Explain. b. A faculty member in the Mathematics Department believes that the fall enrollment provides a very good predictor of the spring enrollment. Do you agree? c. After examining a scatterplot with the least squares regression line for predicting spring enrollment from fall enrollment, two faculty members begin a debate about the possible influence of a particular point. Identify the point that the faculty members are concerned about. d. Fit the least squares line for predicting math enrollment in the spring from math enrollment in the fall, with and without the point you identified in part (c). Would you tag this point as influential? Explain
Step by Step Solution
There are 3 Steps involved in it

Get step-by-step solutions from verified subject matter experts