

Question: please answer all Instructor-created question Question Help (a) Use the accompanying data table to draw a normal probability plot. b) Determine the most likely value
please answer all
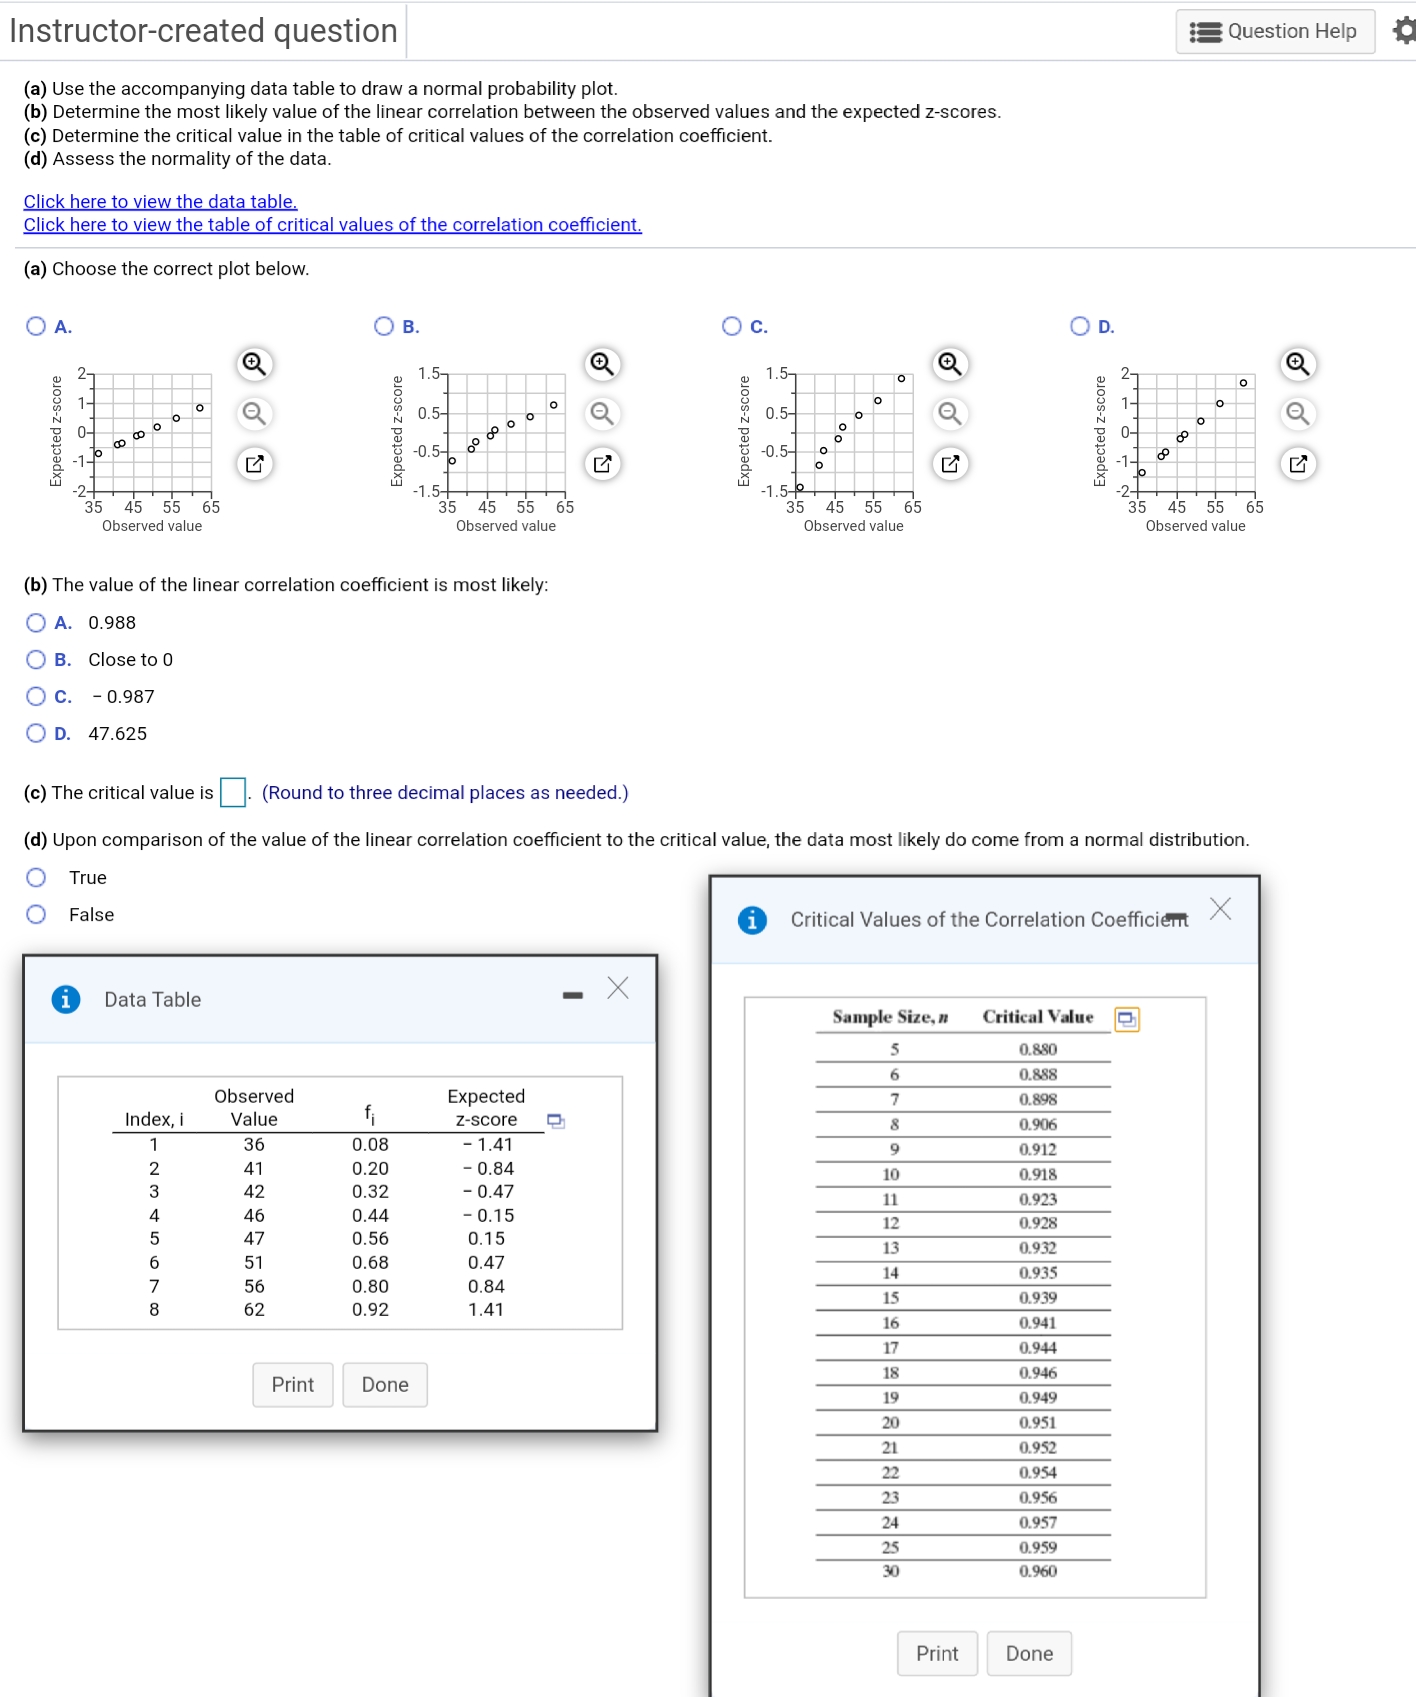
Instructor-created question Question Help (a) Use the accompanying data table to draw a normal probability plot. b) Determine the most likely value of the linear correlation between the observed values and the expected z-scores c) Determine the critical value in the table of critical values of the correlation coefficient. d) Assess the normality of the data Click here to view the data table. Click here to view the table of critical values of the correlation coefficient. (a) Choose the correct plot below. O A. OB O C. O D. Expected z-score Expected z-score 1.57 Expected z-score 1.57 0.5- 0.5- O o -0.5- 60 0.5- -2- 35 45 55 65 1.5+ Expected z-score 35 45 55 65 5-9 65 -2- 35 45 55 2 25 45 55 65 Observed value Observed value Observed value Observed value (b) The value of the linear correlation coefficient is most likely: O A. 0.988 O B. Close to 0 O C. - 0.987 O D. 47.625 (c) The critical value is . (Round to three decimal places as needed.) (d) Upon comparison of the value of the linear correlation coefficient to the critical value, the data most likely do come from a normal distribution. True False i Critical Values of the Correlation Coefficient X i Data Table - X Sample Size, n Critical Value 0.880 0.888 Observed Expected 7 0.898 Index, i Value z-score 0.906 36 0.08 - 1.41 DO YOULAWN 0.912 41 0.20 - 0.84 42 10 0.918 0.32 - 0.47 0.923 46 0.4 - 0.15 11 0.56 0.15 12 0.928 0.68 0.47 13 0.932 56 0.935 0.80 0.84 62 0.92 1.41 0.939 0.941 0.944 Print Done 0.946 6+60 0.951 0.952 0.954 0.956 0.957 0.959 0.960 Print Done
Step by Step Solution
There are 3 Steps involved in it

Get step-by-step solutions from verified subject matter experts