

Question: please answer all of them The Flu Shot Process For RedPharm, a pharmacy located in a college campus, fall is the busy fiu-shot season. The
please answer all of them
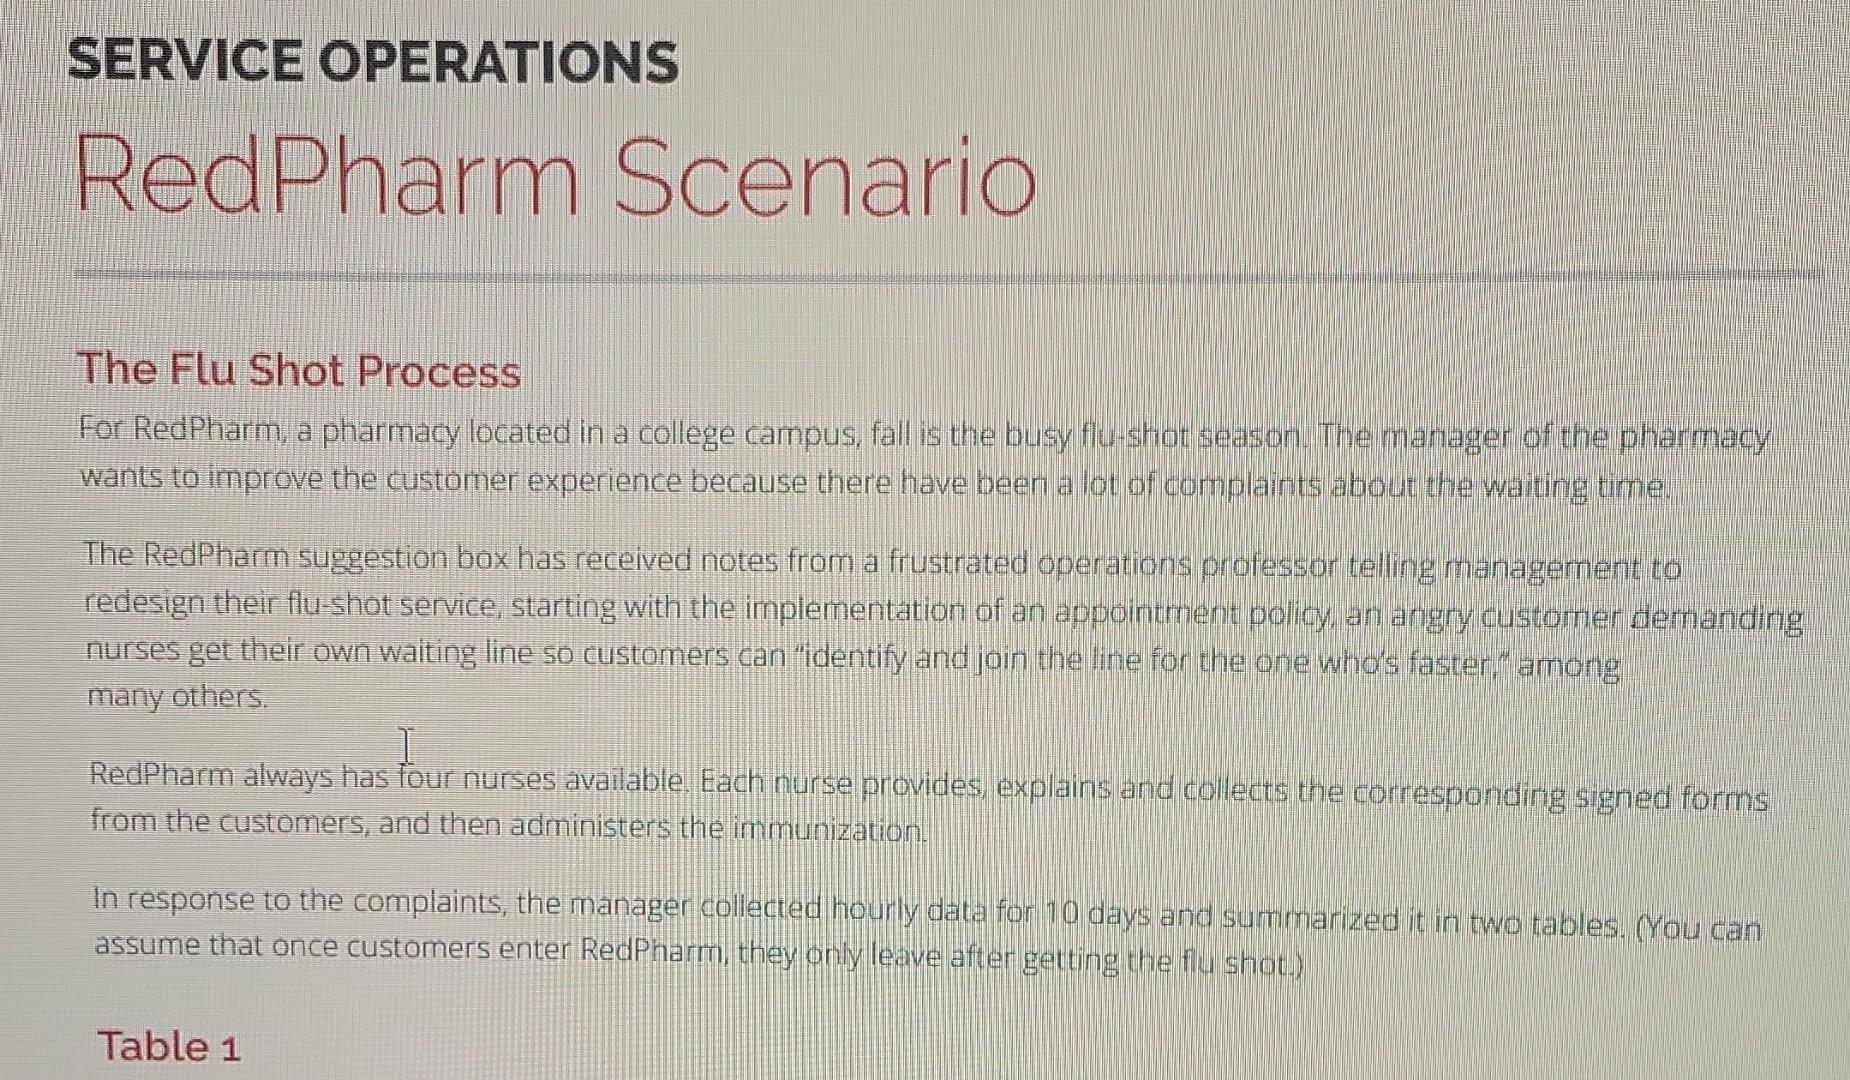
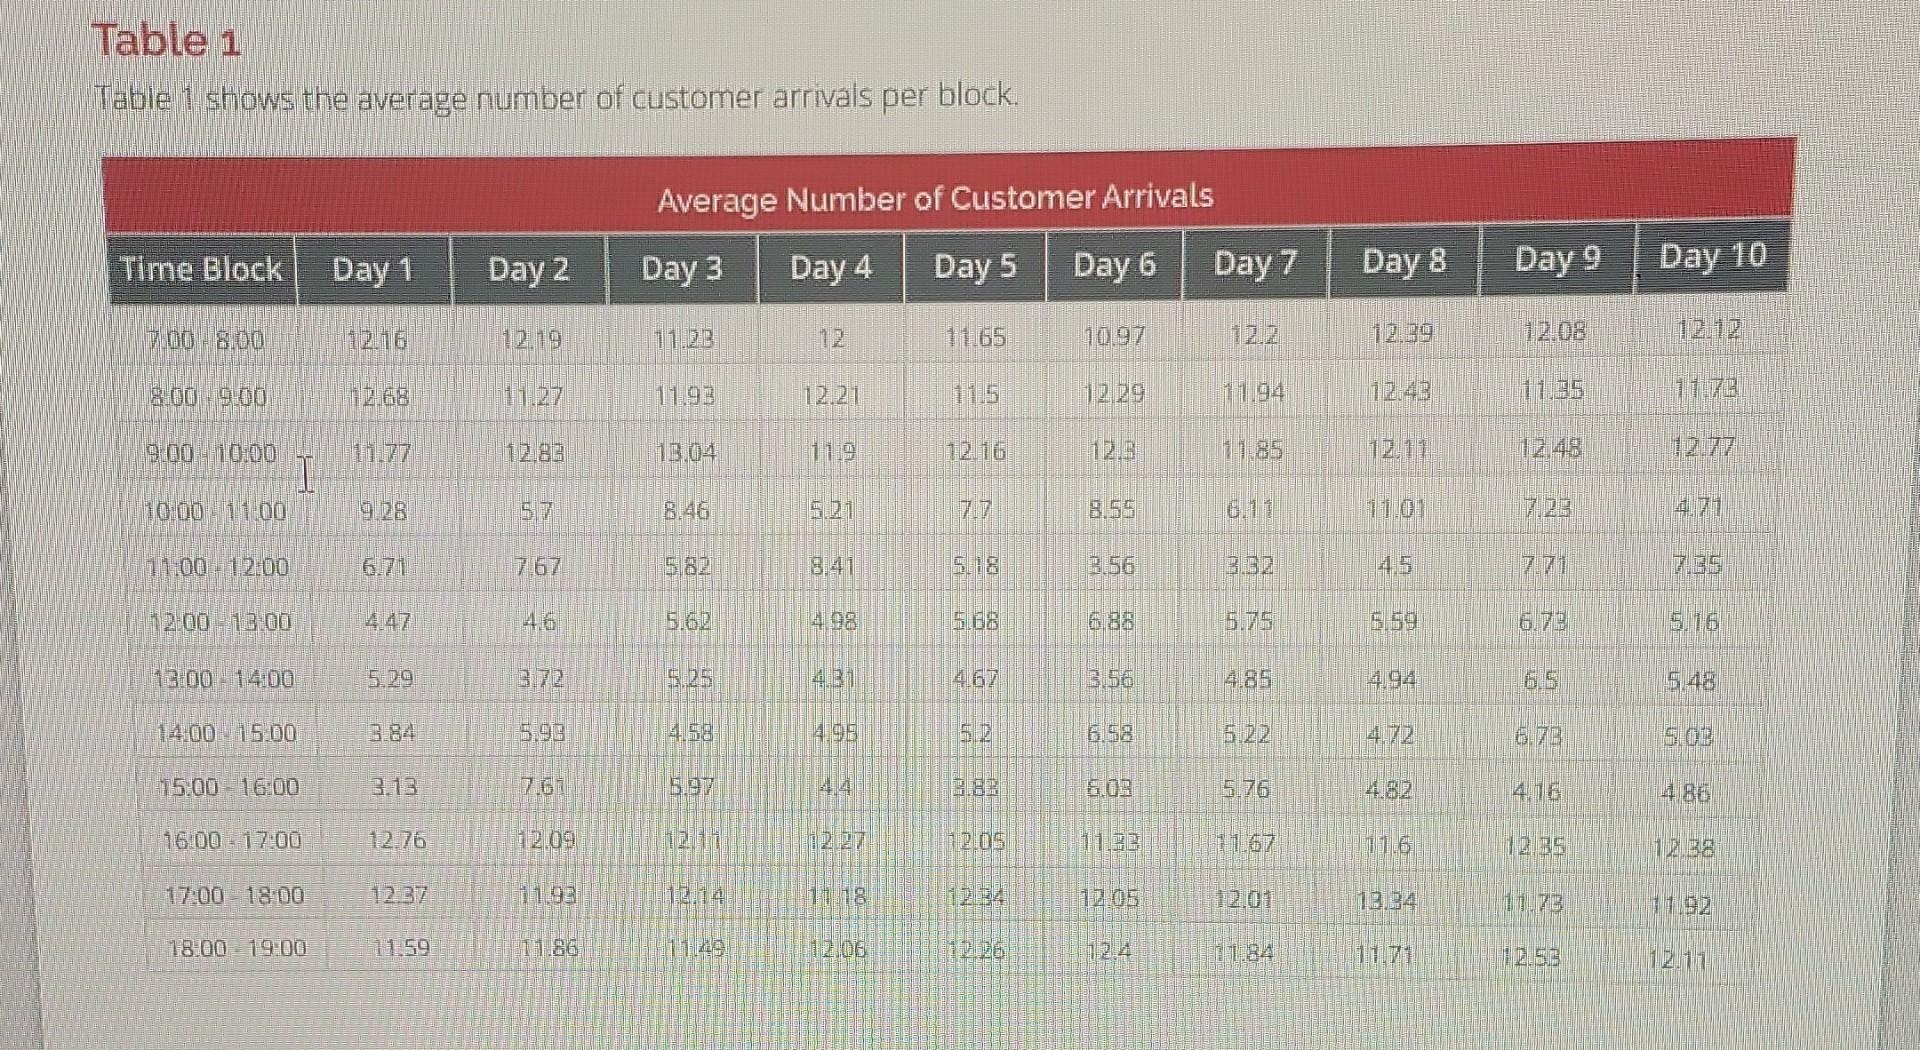
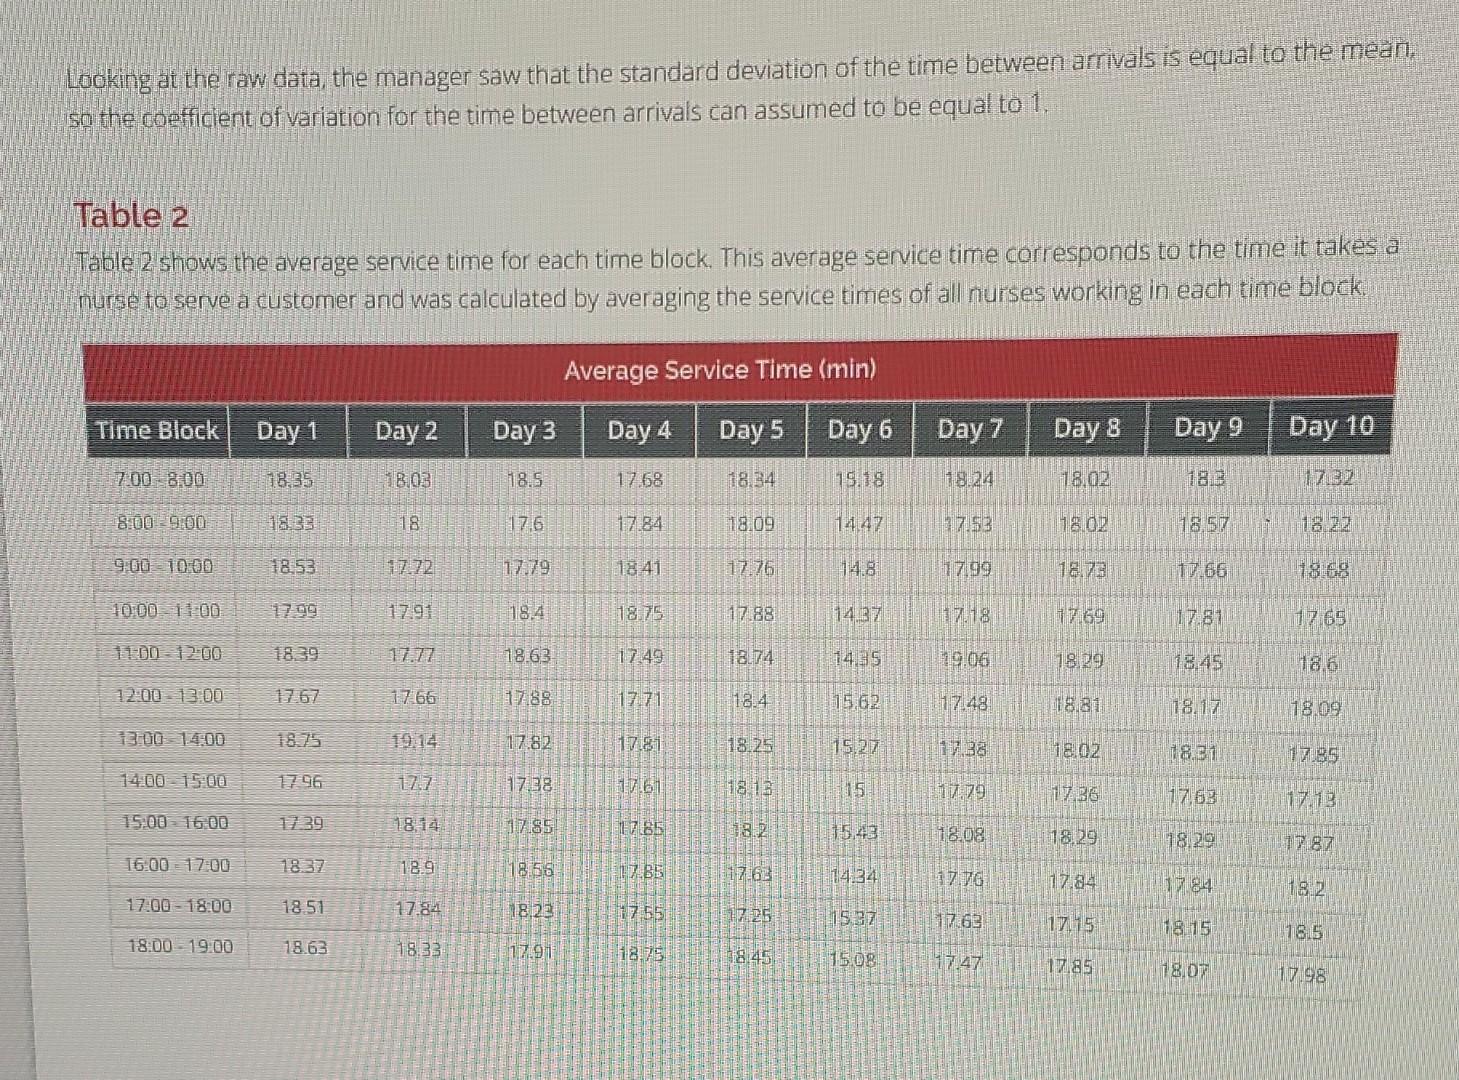
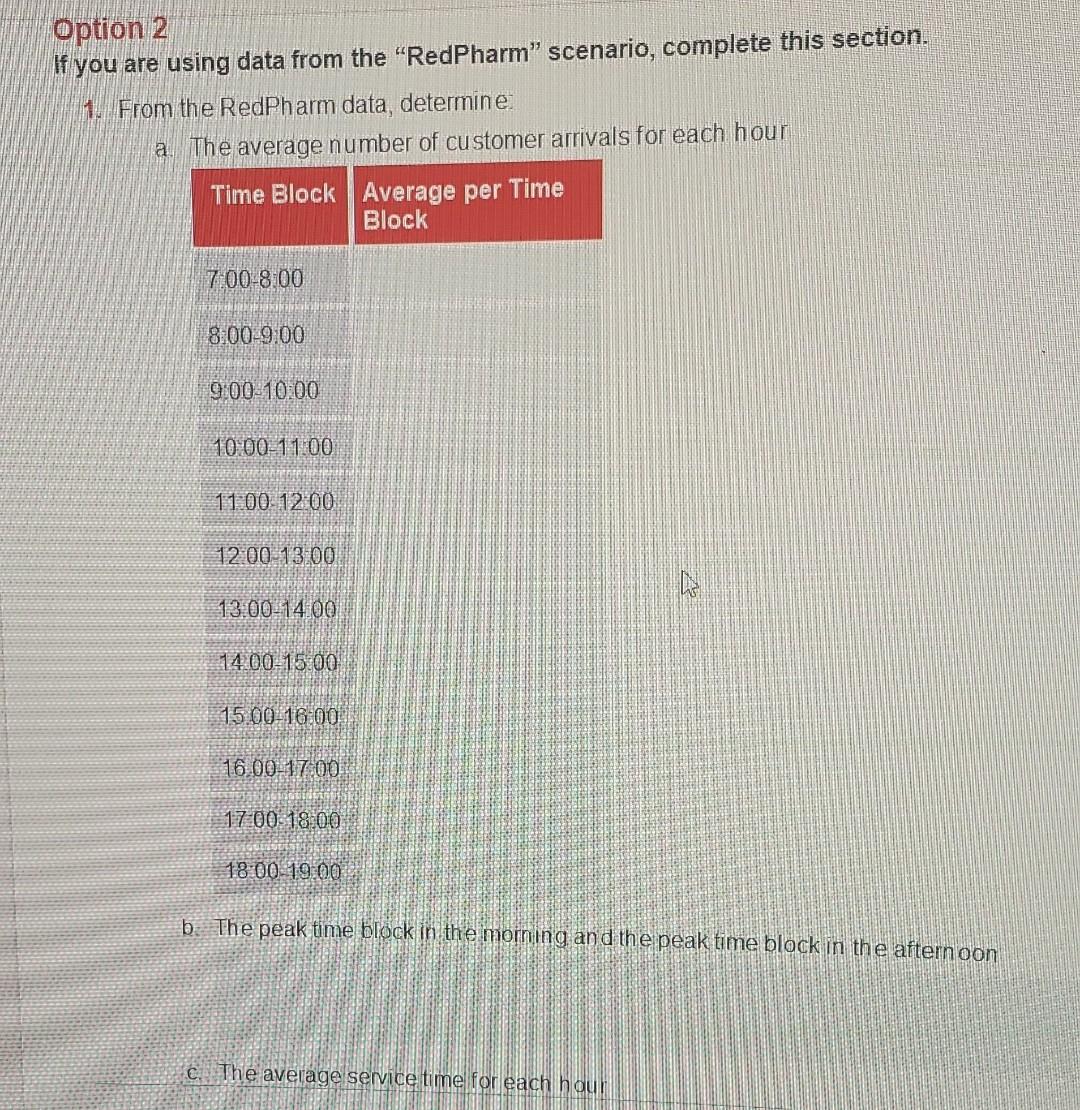
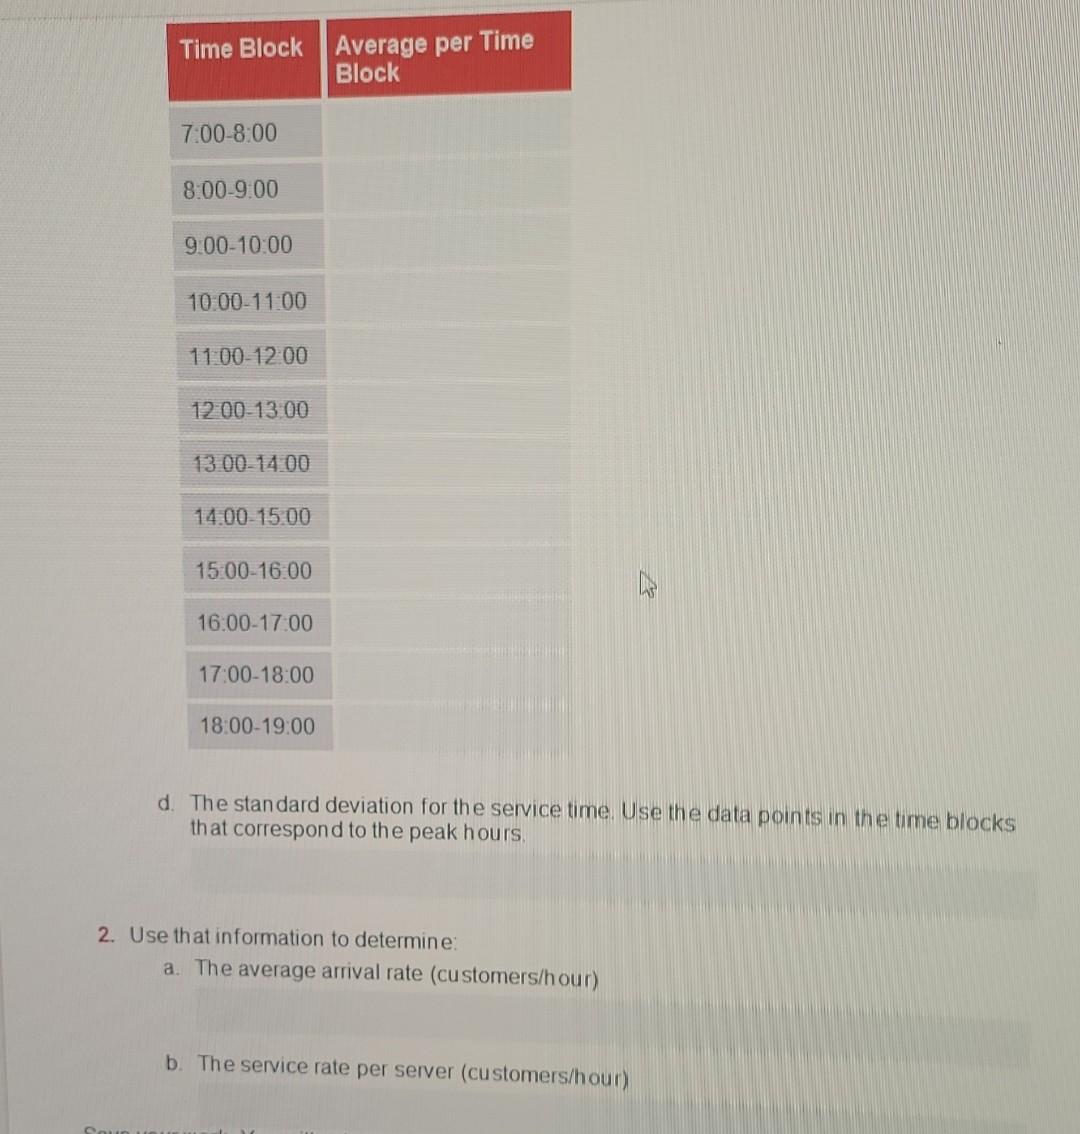
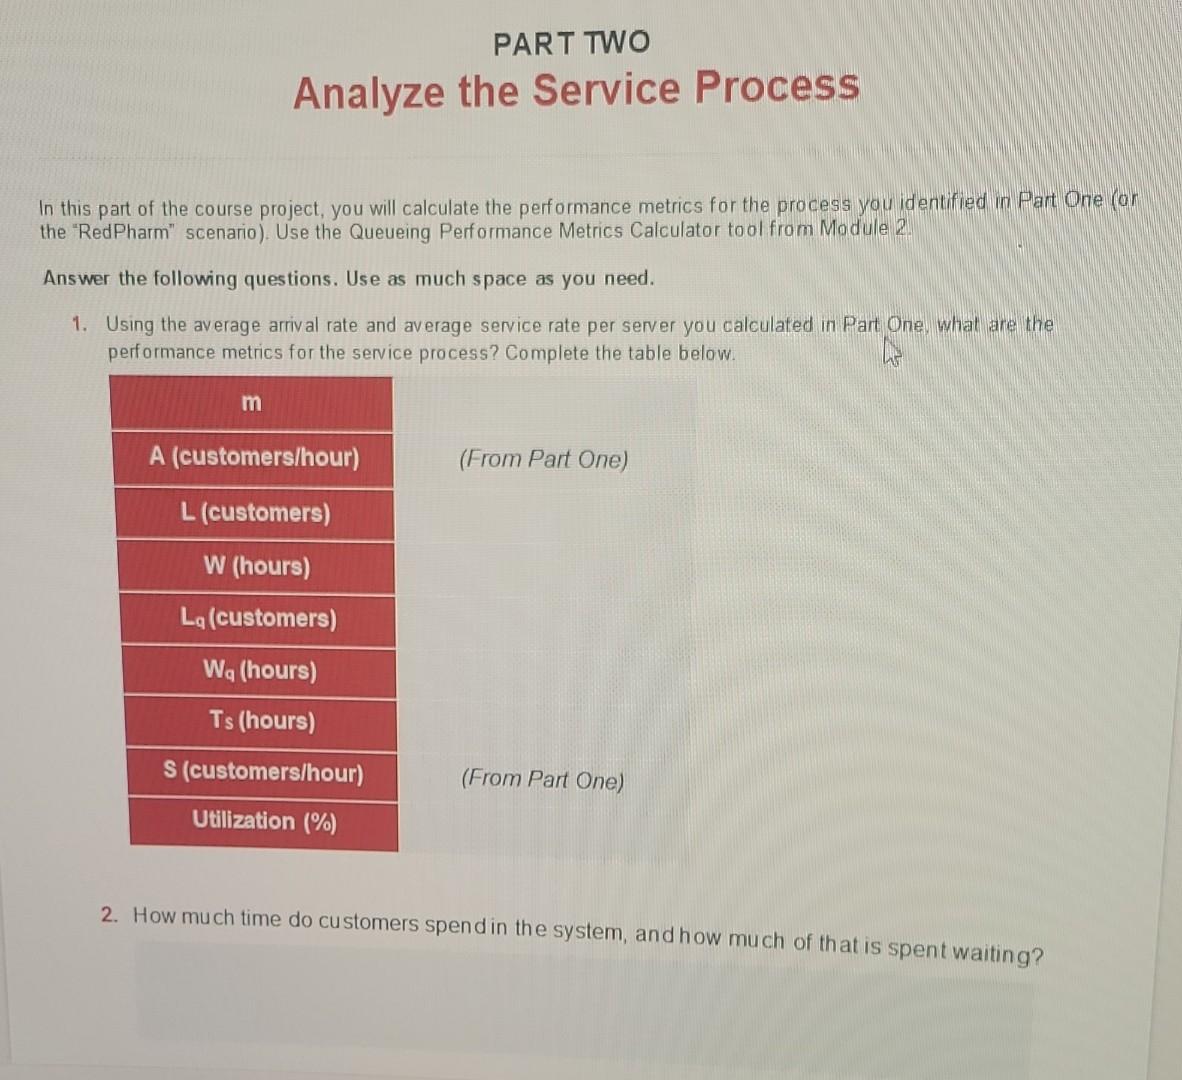
The Flu Shot Process For RedPharm, a pharmacy located in a college campus, fall is the busy fiu-shot season. The manager of the pharmacy wants to improve the customer experience because there have been a lot of complaints about the wating time. The RedPharm suggestion box has received notes from a frustrated operations professor telling managernent to redesign their flu-shot service, starting with the implementation of an appointment policy, an angry customer demanding nurses get their own waiting line so customers can "identify and join the line for the one who's faster" among many others. RedPharm always has four nurses available. Each nurse provides, explains and collects the corresponding signed forms from the customers, and then administers the immunization. In response to the complaints, the manager collected hourly data for 10 days and summarized it in two tables. (You can assume that once customers enter RedPharm, they only leave after getting the flu shot.) Option 2 If you are using data from the "RedPharm" scenario, complete this section. 1. From the RedPharm data, determine. a. The average number of customer arrivals for each hour b. The peak time brock in the morning and the peak time block in the afternoon c. The average senice time for each hour Instructions: In this project, you will analyze a service process and recommend strategies for improving it. Ideally, you will gather data from and analyze a service process in your own organization, but if you're unable to do that, you may use the "RedPharm" scenario, which you can download from the Project. Part One page in Canvas. Except as indicated, use this document to record all your project work and responses to any questions. At a minimum you will need to turn in a digital copy of this document to your instructor as part of your project completion. You may also have additional supporting documents that you will need to submit. Your instructor will provide feedback to help you work through your fin dings Note: Though your work will only be seen by those grading the course and will not be used or shared outside the course, you sh ould take care to obscure any information you feel might be of a sen sitive or confidential nature. Complete each project part as you progress through the course. Wait to submit the project until all parts are complete. Begin your course project by completing Part One below. Information about the grading rubric is available on any of the course project assignment pages online. Do not hesitate to contact your instructor if you have any questions about the project. Looking at the raw data, the manager saw that the standard deviation of the time between arrivals is equal to the mean. so the coefficient of variation for the time between arrivals can assumed to be equal to 1. Table 2 Table 2 shows the average service time for each time block. This average service time corresponds to the time it takes a nurse to serve a customer and was calculated by averaging the service times of all nuises working in each time block. PART TWO Analyze the Service Process In this part of the course project, you will calculate the performance metrics for the process you identified in Part One (or the "RedPharm" scenario). Use the Queueing Performance Metrics Calculator tool from Module 2. Answer the following questions. Use as much space as you need. 1. Using the average arrival rate and average service rate per server you calculated in Part One, what are the performance metrics for the service process? Complete the table below. 2. How much time do customers spend in the system, and how much of that is spent waiting? Table 1 Table 1 shows the average number of customer arrivals per block. d. The standard deviation for the service time. Use the data points in the time blocks that correspond to the peak hours. 2. Use that information to determine: a. The average arrival rate (customers/hour) b. The service rate per server (customers/hour) The Flu Shot Process For RedPharm, a pharmacy located in a college campus, fall is the busy fiu-shot season. The manager of the pharmacy wants to improve the customer experience because there have been a lot of complaints about the wating time. The RedPharm suggestion box has received notes from a frustrated operations professor telling managernent to redesign their flu-shot service, starting with the implementation of an appointment policy, an angry customer demanding nurses get their own waiting line so customers can "identify and join the line for the one who's faster" among many others. RedPharm always has four nurses available. Each nurse provides, explains and collects the corresponding signed forms from the customers, and then administers the immunization. In response to the complaints, the manager collected hourly data for 10 days and summarized it in two tables. (You can assume that once customers enter RedPharm, they only leave after getting the flu shot.) Option 2 If you are using data from the "RedPharm" scenario, complete this section. 1. From the RedPharm data, determine. a. The average number of customer arrivals for each hour b. The peak time brock in the morning and the peak time block in the afternoon c. The average senice time for each hour Instructions: In this project, you will analyze a service process and recommend strategies for improving it. Ideally, you will gather data from and analyze a service process in your own organization, but if you're unable to do that, you may use the "RedPharm" scenario, which you can download from the Project. Part One page in Canvas. Except as indicated, use this document to record all your project work and responses to any questions. At a minimum you will need to turn in a digital copy of this document to your instructor as part of your project completion. You may also have additional supporting documents that you will need to submit. Your instructor will provide feedback to help you work through your fin dings Note: Though your work will only be seen by those grading the course and will not be used or shared outside the course, you sh ould take care to obscure any information you feel might be of a sen sitive or confidential nature. Complete each project part as you progress through the course. Wait to submit the project until all parts are complete. Begin your course project by completing Part One below. Information about the grading rubric is available on any of the course project assignment pages online. Do not hesitate to contact your instructor if you have any questions about the project. Looking at the raw data, the manager saw that the standard deviation of the time between arrivals is equal to the mean. so the coefficient of variation for the time between arrivals can assumed to be equal to 1. Table 2 Table 2 shows the average service time for each time block. This average service time corresponds to the time it takes a nurse to serve a customer and was calculated by averaging the service times of all nuises working in each time block. PART TWO Analyze the Service Process In this part of the course project, you will calculate the performance metrics for the process you identified in Part One (or the "RedPharm" scenario). Use the Queueing Performance Metrics Calculator tool from Module 2. Answer the following questions. Use as much space as you need. 1. Using the average arrival rate and average service rate per server you calculated in Part One, what are the performance metrics for the service process? Complete the table below. 2. How much time do customers spend in the system, and how much of that is spent waiting? Table 1 Table 1 shows the average number of customer arrivals per block. d. The standard deviation for the service time. Use the data points in the time blocks that correspond to the peak hours. 2. Use that information to determine: a. The average arrival rate (customers/hour) b. The service rate per server (customers/hour)
Step by Step Solution
There are 3 Steps involved in it

Get step-by-step solutions from verified subject matter experts