

Question: Please answer all parts and draw a graph!!! As soon as possible! Thank you Private domestic consumption C in a small closed economy can be
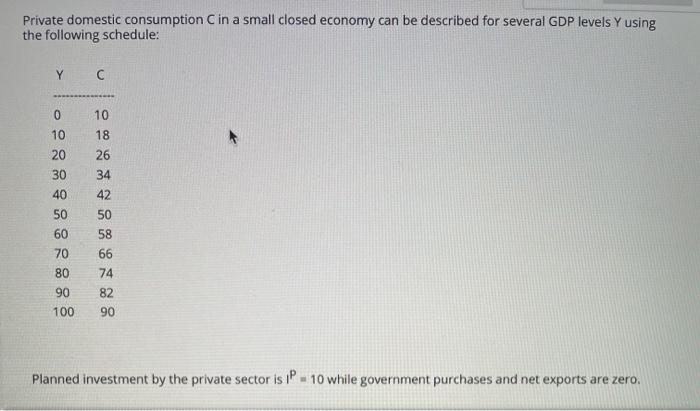
Private domestic consumption C in a small closed economy can be described for several GDP levels Y using the following schedule: Planned investment by the private sector is IP=10 while government purchases and net exports are zero. Planned investment by the private sector is IP=10 while government purchases and net exports are zero. (i) Obtain the marginal propensity to save (MPS), the spending multiplier (m), the equilibrium GDP and the equilibrium level of private savings S for this economy. (ii) Firms anticipate a decrease in sales due to the pandemic so they decide to downsize by reducing investment to IP=6. What will happen to GDP and to private savings? (iii) The contraction in economic activity described in (ii) translates into increased unemployment and generalized household indebtness. In order to restore financial health by increasing private savings, the government promotes austerity from the part of the population. People responds by reducing autonomous consumption from 10 to 6 . What will happen to the equilibrium GDP and to private savings as a consequence of this behavioral change? Obtain the new values of Y and S as part of your answer. (iv) Using a single graph, describe the equilibriun GDP corresponding to the scenarios described in parts (i), (ii) and (iii). You may attach a picture of the graph to an email and send it to gi. (v) Comparing (i) and (iii), can you conclude that the austerity drive has contributed to increase private savings? Why? Explain. Private domestic consumption C in a small closed economy can be described for several GDP levels Y using the following schedule: Planned investment by the private sector is IP=10 while government purchases and net exports are zero. Planned investment by the private sector is IP=10 while government purchases and net exports are zero. (i) Obtain the marginal propensity to save (MPS), the spending multiplier (m), the equilibrium GDP and the equilibrium level of private savings S for this economy. (ii) Firms anticipate a decrease in sales due to the pandemic so they decide to downsize by reducing investment to IP=6. What will happen to GDP and to private savings? (iii) The contraction in economic activity described in (ii) translates into increased unemployment and generalized household indebtness. In order to restore financial health by increasing private savings, the government promotes austerity from the part of the population. People responds by reducing autonomous consumption from 10 to 6 . What will happen to the equilibrium GDP and to private savings as a consequence of this behavioral change? Obtain the new values of Y and S as part of your answer. (iv) Using a single graph, describe the equilibriun GDP corresponding to the scenarios described in parts (i), (ii) and (iii). You may attach a picture of the graph to an email and send it to gi. (v) Comparing (i) and (iii), can you conclude that the austerity drive has contributed to increase private savings? Why? Explain
Step by Step Solution
There are 3 Steps involved in it

Get step-by-step solutions from verified subject matter experts