

Question: PLEASE ANSWER ALL PARTS AND EXPLAIN. WILL LIKE a) Use a 2-month moving average on all the data and plot the averages and the prices.
PLEASE ANSWER ALL PARTS AND EXPLAIN. WILL LIKE
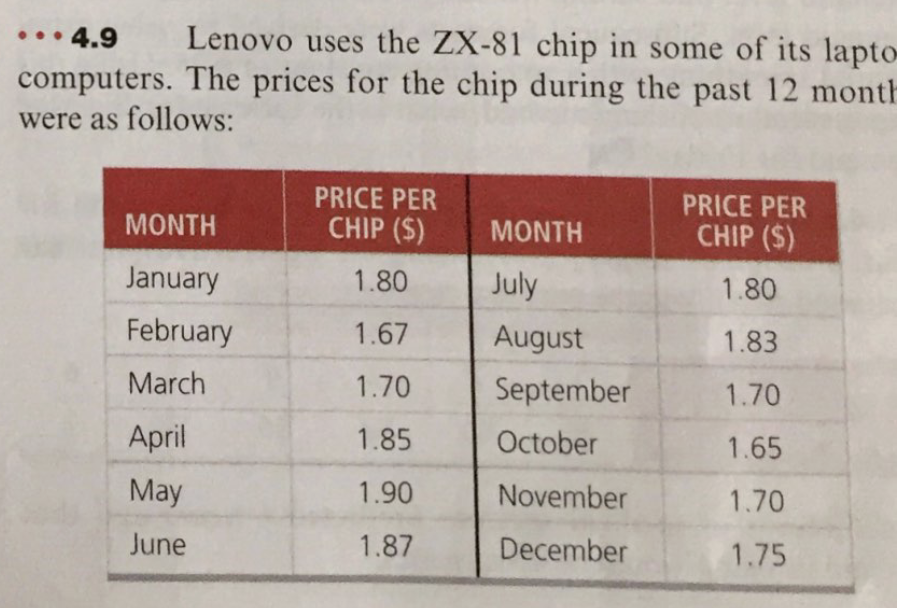
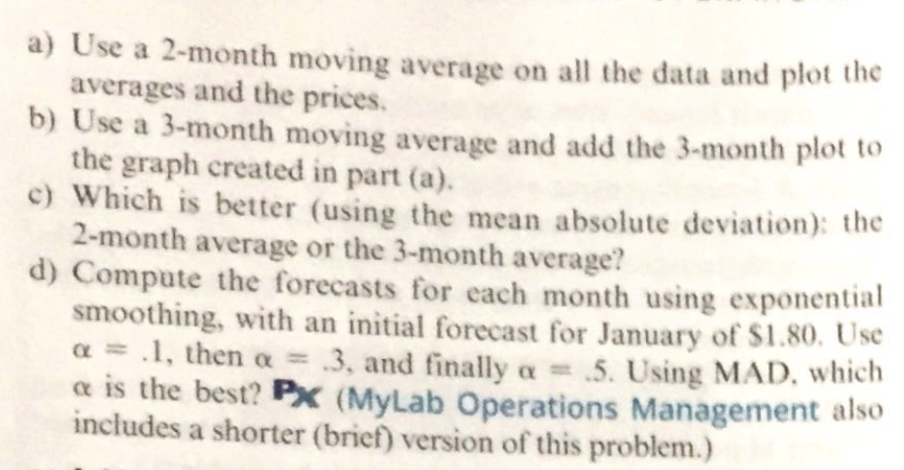
a) Use a 2-month moving average on all the data and plot the averages and the prices. b) Use a 3-month moving average and add the 3-month plot to the graph created in part (a). c) Which is better (using the mean absolute deviation): the 2-month average or the 3 -month average? d) Compute the forecasts for each month using exponential smoothing, with an initial forecast for January of \$1.80. Use =.1, then =3, and finally =.5. Using MAD, which is the best? P (MyLab Operations Management also includes a shorter (brief) version of this problem.) a) Use a 2-month moving average on all the data and plot the averages and the prices. b) Use a 3-month moving average and add the 3-month plot to the graph created in part (a). c) Which is better (using the mean absolute deviation): the 2-month average or the 3 -month average? d) Compute the forecasts for each month using exponential smoothing, with an initial forecast for January of \$1.80. Use =.1, then =3, and finally =.5. Using MAD, which is the best? P (MyLab Operations Management also includes a shorter (brief) version of this problem.)
Step by Step Solution
There are 3 Steps involved in it

Get step-by-step solutions from verified subject matter experts