

Question: please answer all parts Efficient Frontier assignment Must be done in Excel You are to pick two different publicly traded stocks that you want to
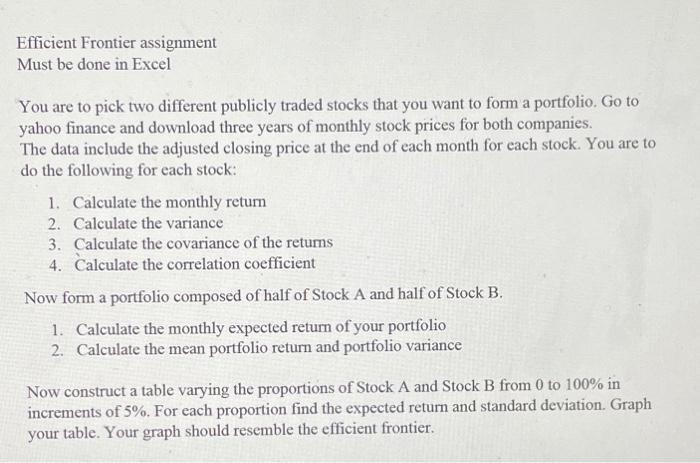
Efficient Frontier assignment Must be done in Excel You are to pick two different publicly traded stocks that you want to form a portfolio. Go to yahoo finance and download three years of monthly stock prices for both companies. The data include the adjusted closing price at the end of each month for each stock. You are to do the following for each stock: 1. Calculate the monthly return 2. Calculate the variance 3. Calculate the covariance of the retums 4. Calculate the correlation coefficient Now form a portfolio composed of half of Stock A and half of Stock B. 1. Calculate the monthly expected return of your portfolio 2. Calculate the mean portfolio return and portfolio variance Now construct a table varying the proportions of Stock A and Stock B from 0 to 100% in increments of 5%. For each proportion find the expected return and standard deviation. Graph your table. Your graph should resemble the efficient frontier. Efficient Frontier assignment Must be done in Excel You are to pick two different publicly traded stocks that you want to form a portfolio. Go to yahoo finance and download three years of monthly stock prices for both companies. The data include the adjusted closing price at the end of each month for each stock. You are to do the following for each stock: 1. Calculate the monthly return 2. Calculate the variance 3. Calculate the covariance of the retums 4. Calculate the correlation coefficient Now form a portfolio composed of half of Stock A and half of Stock B. 1. Calculate the monthly expected return of your portfolio 2. Calculate the mean portfolio return and portfolio variance Now construct a table varying the proportions of Stock A and Stock B from 0 to 100% in increments of 5%. For each proportion find the expected return and standard deviation. Graph your table. Your graph should resemble the efficient frontier
Step by Step Solution
There are 3 Steps involved in it

Get step-by-step solutions from verified subject matter experts