

Question: please answer all parts. for parts please answer average return for small stocks, S&P 500, and corporate Bond example is shown below. Download the data
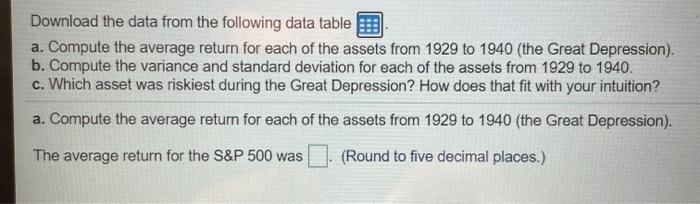
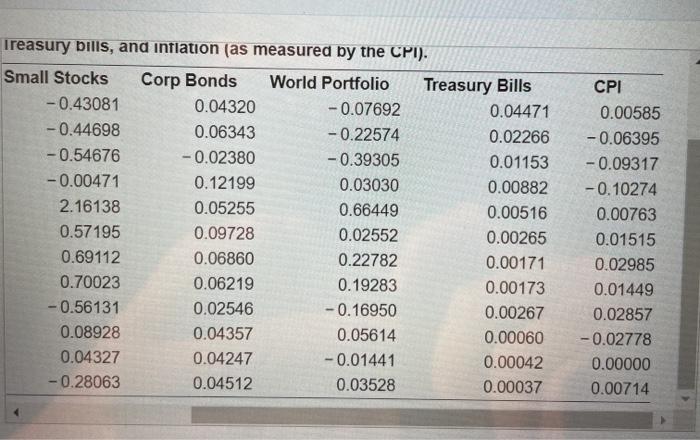
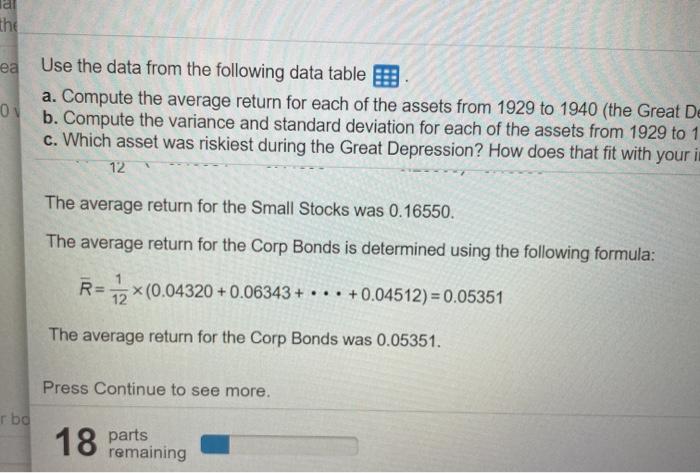
Download the data from the following data table a. Compute the average return for each of the assets from 1929 to 1940 (the Great Depression). b. Compute the variance and standard deviation for each of the assets from 1929 to 1940. C. Which asset was riskiest during the Great Depression? How does that fit with your intuition? a. Compute the average return for each of the assets from 1929 to 1940 (the Great Depression). The average return for the S&P 500 was (Round to five decimal places.) Treasury bills, and inflation (as measured by the CPI). Small Stocks Corp Bonds World Portfolio Treasury Bills -0.43081 0.04320 -0.07692 0.04471 -0.44698 0.06343 -0.22574 0.02266 -0.54676 -0.02380 -0.39305 0.01153 -0.00471 0.12199 0.03030 0.00882 2.16138 0.05255 0.66449 0.00516 0.57195 0.09728 0.02552 0.00265 0.69112 0.06860 0.22782 0.00171 0.70023 0.06219 0.19283 0.00173 -0.56131 0.02546 -0.16950 0.00267 0.08928 0.04357 0.05614 0.00060 0.04327 0.04247 -0.01441 0.00042 -0.28063 0.04512 0.03528 0.00037 CPI 0.00585 -0.06395 -0.09317 -0.10274 0.00763 0.01515 0.02985 0.01449 0.02857 -0.02778 0.00000 0.00714 ea Use the data from the following data table 1 a. Compute the average return for each of the assets from 1929 to 1940 (the Great De O b. Compute the variance and standard deviation for each of the assets from 1929 to 1 c. Which asset was riskiest during the Great Depression? How does that fit with your in 12 The average return for the Small Stocks was 0.16550. The average return for the Corp Bonds is determined using the following formula: R= 12x(0.04320 +0.06343 + +0.04512) = 0.05351 The average return for the Corp Bonds was 0.05351. Press Continue to see more. rbo 18 parts remaining Download the data from the following data table a. Compute the average return for each of the assets from 1929 to 1940 (the Great Depression). b. Compute the variance and standard deviation for each of the assets from 1929 to 1940. C. Which asset was riskiest during the Great Depression? How does that fit with your intuition? a. Compute the average return for each of the assets from 1929 to 1940 (the Great Depression). The average return for the S&P 500 was (Round to five decimal places.) Treasury bills, and inflation (as measured by the CPI). Small Stocks Corp Bonds World Portfolio Treasury Bills -0.43081 0.04320 -0.07692 0.04471 -0.44698 0.06343 -0.22574 0.02266 -0.54676 -0.02380 -0.39305 0.01153 -0.00471 0.12199 0.03030 0.00882 2.16138 0.05255 0.66449 0.00516 0.57195 0.09728 0.02552 0.00265 0.69112 0.06860 0.22782 0.00171 0.70023 0.06219 0.19283 0.00173 -0.56131 0.02546 -0.16950 0.00267 0.08928 0.04357 0.05614 0.00060 0.04327 0.04247 -0.01441 0.00042 -0.28063 0.04512 0.03528 0.00037 CPI 0.00585 -0.06395 -0.09317 -0.10274 0.00763 0.01515 0.02985 0.01449 0.02857 -0.02778 0.00000 0.00714 ea Use the data from the following data table 1 a. Compute the average return for each of the assets from 1929 to 1940 (the Great De O b. Compute the variance and standard deviation for each of the assets from 1929 to 1 c. Which asset was riskiest during the Great Depression? How does that fit with your in 12 The average return for the Small Stocks was 0.16550. The average return for the Corp Bonds is determined using the following formula: R= 12x(0.04320 +0.06343 + +0.04512) = 0.05351 The average return for the Corp Bonds was 0.05351. Press Continue to see more. rbo 18 parts remaining
Step by Step Solution
There are 3 Steps involved in it

Get step-by-step solutions from verified subject matter experts