

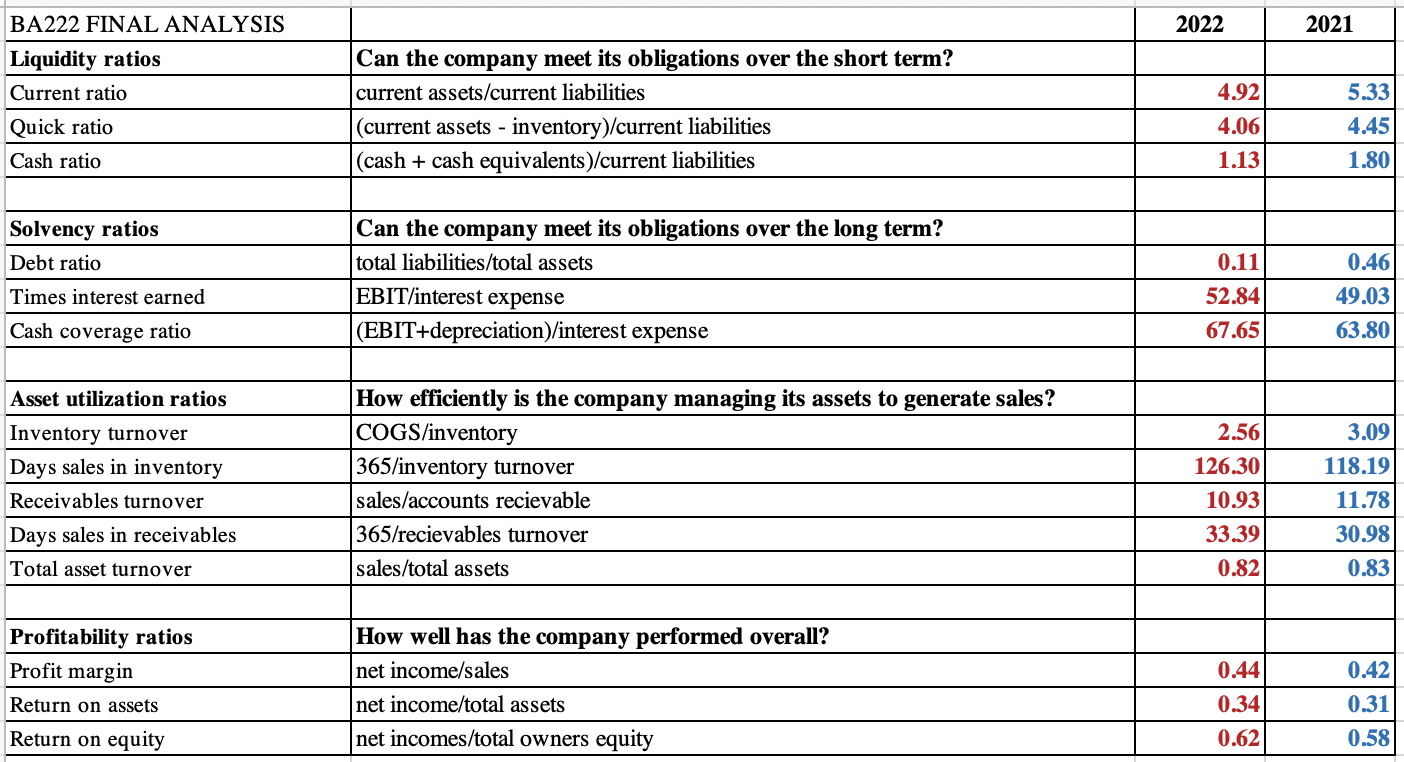
Question: PLEASE ANSWER ALL PARTS!!!! From the table below, which includes the ratio value for both years, and the amount of change over the prior year,
PLEASE ANSWER ALL PARTS!!!! From the table below, which includes the ratio value for both years, and the amount of change over the prior year, describe whether the ratio for the current year is more or less favorable than the preceding year.
For at least 5 of the ratios, you have calculated include a paragraph (one for each ratio) consisting of:
(a) Insights (if any) from the MD & A as to why the ratio is better or worse than the prior year
(b) Your own explanation of what has caused the ratio to be better or worse than the prior year.
MD&A
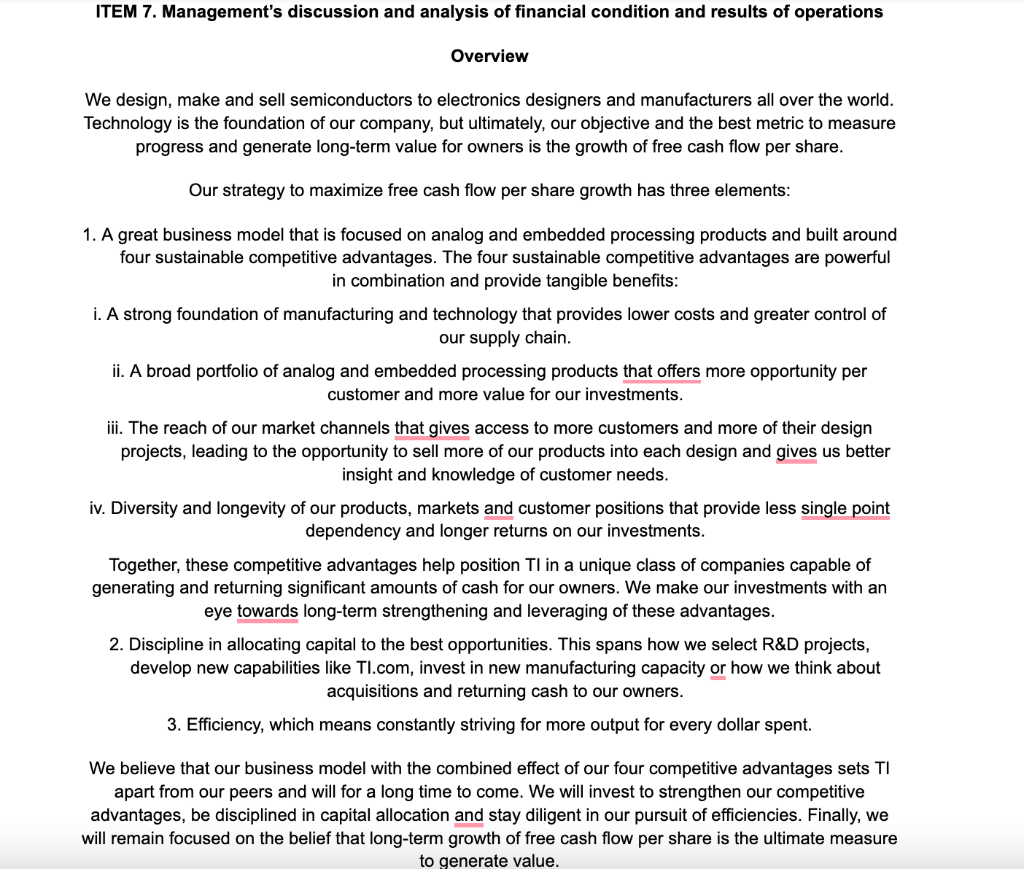
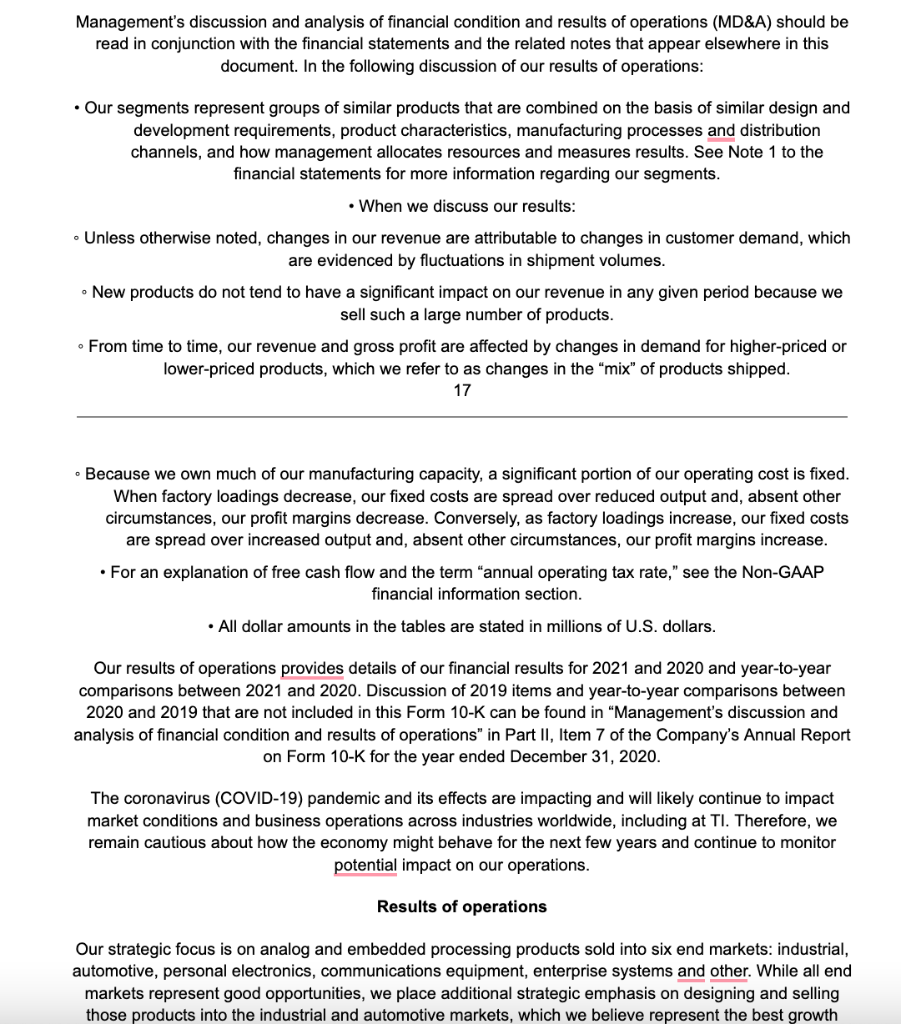
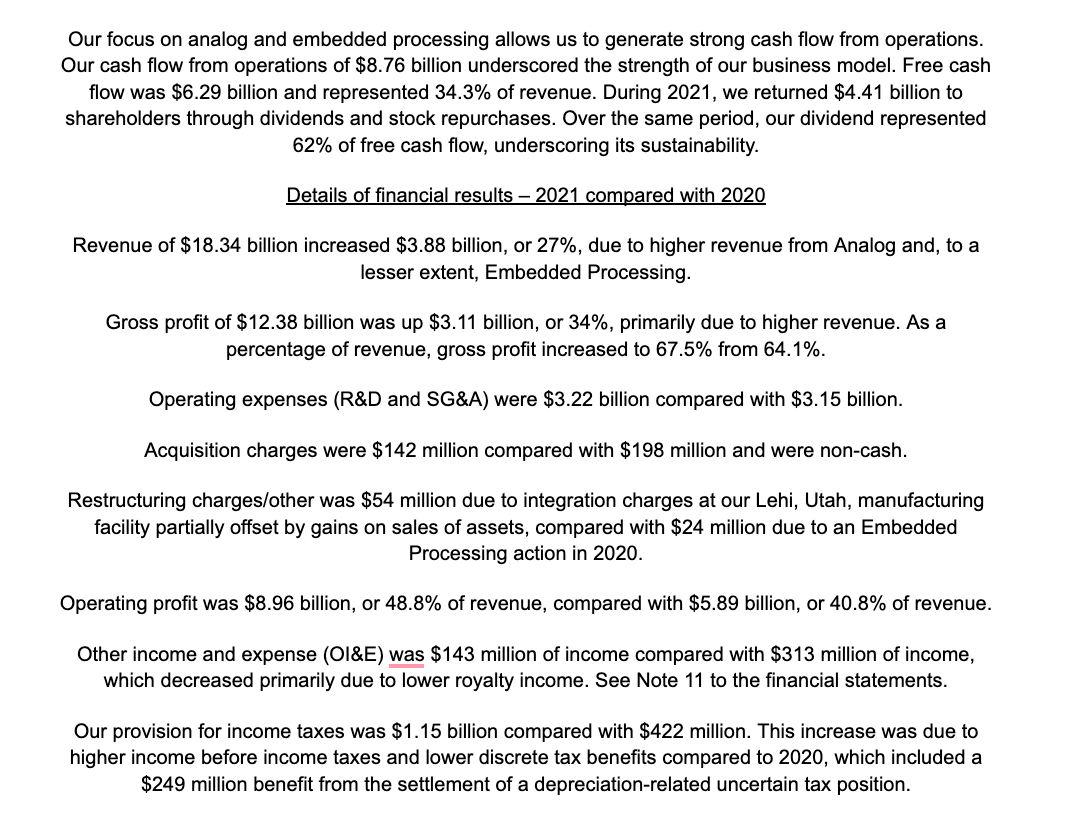
Overview We design, make and sell semiconductors to electronics designers and manufacturers all over the world. Technology is the foundation of our company, but ultimately, our objective and the best metric to measure progress and generate long-term value for owners is the growth of free cash flow per share. Our strategy to maximize free cash flow per share growth has three elements: 1. A great business model that is focused on analog and embedded processing products and built around four sustainable competitive advantages. The four sustainable competitive advantages are powerful in combination and provide tangible benefits: i. A strong foundation of manufacturing and technology that provides lower costs and greater control of our supply chain. ii. A broad portfolio of analog and embedded processing products that offers more opportunity per customer and more value for our investments. iii. The reach of our market channels that gives access to more customers and more of their design projects, leading to the opportunity to sell more of our products into each design and gives us better insight and knowledge of customer needs. iv. Diversity and longevity of our products, markets and customer positions that provide less single point dependency and longer returns on our investments. Together, these competitive advantages help position TI in a unique class of companies capable of generating and returning significant amounts of cash for our owners. We make our investments with an eye towards long-term strengthening and leveraging of these advantages. 2. Discipline in allocating capital to the best opportunities. This spans how we select R\&D projects, develop new capabilities like TI.com, invest in new manufacturing capacity or how we think about acquisitions and returning cash to our owners. 3. Efficiency, which means constantly striving for more output for every dollar spent. We believe that our business model with the combined effect of our four competitive advantages sets TI apart from our peers and will for a long time to come. We will invest to strengthen our competitive advantages, be disciplined in capital allocation and stay diligent in our pursuit of efficiencies. Finally, we will remain focused on the belief that long-term growth of free cash flow per share is the ultimate measure to generate value. Management's discussion and analysis of financial condition and results of operations (MD\&A) should be read in conjunction with the financial statements and the related notes that appear elsewhere in this document. In the following discussion of our results of operations: - Our segments represent groups of similar products that are combined on the basis of similar design and development requirements, product characteristics, manufacturing processes and distribution channels, and how management allocates resources and measures results. See Note 1 to the financial statements for more information regarding our segments. -When we discuss our results: - Unless otherwise noted, changes in our revenue are attributable to changes in customer demand, which are evidenced by fluctuations in shipment volumes. - New products do not tend to have a significant impact on our revenue in any given period because we sell such a large number of products. - From time to time, our revenue and gross profit are affected by changes in demand for higher-priced or lower-priced products, which we refer to as changes in the "mix" of products shipped. 17 - Because we own much of our manufacturing capacity, a significant portion of our operating cost is fixed. When factory loadings decrease, our fixed costs are spread over reduced output and, absent other circumstances, our profit margins decrease. Conversely, as factory loadings increase, our fixed costs are spread over increased output and, absent other circumstances, our profit margins increase. - For an explanation of free cash flow and the term "annual operating tax rate," see the Non-GAAP financial information section. - All dollar amounts in the tables are stated in millions of U.S. dollars. Our results of operations provides details of our financial results for 2021 and 2020 and year-to-year comparisons between 2021 and 2020 . Discussion of 2019 items and year-to-year comparisons between 2020 and 2019 that are not included in this Form 10-K can be found in "Management's discussion and analysis of financial condition and results of operations" in Part II, Item 7 of the Company's Annual Report on Form 10-K for the year ended December 31, 2020. The coronavirus (COVID-19) pandemic and its effects are impacting and will likely continue to impact market conditions and business operations across industries worldwide, including at TI. Therefore, we remain cautious about how the economy might behave for the next few years and continue to monitor potential impact on our operations. Results of operations Our strategic focus is on analog and embedded processing products sold into six end markets: industrial, automotive, personal electronics, communications equipment, enterprise systems and other. While all end markets represent good opportunities, we place additional strategic emphasis on designing and selling those products into the industrial and automotive markets, which we believe represent the best growth Our focus on analog and embedded processing allows us to generate strong cash flow from operations. Our cash flow from operations of $8.76 billion underscored the strength of our business model. Free cash flow was $6.29 billion and represented 34.3% of revenue. During 2021 , we returned $4.41 billion to shareholders through dividends and stock repurchases. Over the same period, our dividend represented 62% of free cash flow, underscoring its sustainability. Details of financial results - 2021 compared with 2020 Revenue of $18.34 billion increased $3.88 billion, or 27%, due to higher revenue from Analog and, to a lesser extent, Embedded Processing. Gross profit of $12.38 billion was up $3.11 billion, or 34%, primarily due to higher revenue. As a percentage of revenue, gross profit increased to 67.5% from 64.1%. Operating expenses (R\&D and SG\&A) were $3.22 billion compared with $3.15 billion. Acquisition charges were $142 million compared with $198 million and were non-cash. Restructuring charges/other was $54 million due to integration charges at our Lehi, Utah, manufacturing facility partially offset by gains on sales of assets, compared with $24 million due to an Embedded Processing action in 2020. Operating profit was $8.96 billion, or 48.8% of revenue, compared with $5.89 billion, or 40.8% of revenue. Other income and expense (OI\&E) was \$143 million of income compared with $313 million of income, which decreased primarily due to lower royalty income. See Note 11 to the financial statements. Our provision for income taxes was $1.15 billion compared with $422 million. This increase was due to higher income before income taxes and lower discrete tax benefits compared to 2020 , which included a $249 million benefit from the settlement of a depreciation-related uncertain tax position. Overview We design, make and sell semiconductors to electronics designers and manufacturers all over the world. Technology is the foundation of our company, but ultimately, our objective and the best metric to measure progress and generate long-term value for owners is the growth of free cash flow per share. Our strategy to maximize free cash flow per share growth has three elements: 1. A great business model that is focused on analog and embedded processing products and built around four sustainable competitive advantages. The four sustainable competitive advantages are powerful in combination and provide tangible benefits: i. A strong foundation of manufacturing and technology that provides lower costs and greater control of our supply chain. ii. A broad portfolio of analog and embedded processing products that offers more opportunity per customer and more value for our investments. iii. The reach of our market channels that gives access to more customers and more of their design projects, leading to the opportunity to sell more of our products into each design and gives us better insight and knowledge of customer needs. iv. Diversity and longevity of our products, markets and customer positions that provide less single point dependency and longer returns on our investments. Together, these competitive advantages help position TI in a unique class of companies capable of generating and returning significant amounts of cash for our owners. We make our investments with an eye towards long-term strengthening and leveraging of these advantages. 2. Discipline in allocating capital to the best opportunities. This spans how we select R\&D projects, develop new capabilities like TI.com, invest in new manufacturing capacity or how we think about acquisitions and returning cash to our owners. 3. Efficiency, which means constantly striving for more output for every dollar spent. We believe that our business model with the combined effect of our four competitive advantages sets TI apart from our peers and will for a long time to come. We will invest to strengthen our competitive advantages, be disciplined in capital allocation and stay diligent in our pursuit of efficiencies. Finally, we will remain focused on the belief that long-term growth of free cash flow per share is the ultimate measure to generate value. Management's discussion and analysis of financial condition and results of operations (MD\&A) should be read in conjunction with the financial statements and the related notes that appear elsewhere in this document. In the following discussion of our results of operations: - Our segments represent groups of similar products that are combined on the basis of similar design and development requirements, product characteristics, manufacturing processes and distribution channels, and how management allocates resources and measures results. See Note 1 to the financial statements for more information regarding our segments. -When we discuss our results: - Unless otherwise noted, changes in our revenue are attributable to changes in customer demand, which are evidenced by fluctuations in shipment volumes. - New products do not tend to have a significant impact on our revenue in any given period because we sell such a large number of products. - From time to time, our revenue and gross profit are affected by changes in demand for higher-priced or lower-priced products, which we refer to as changes in the "mix" of products shipped. 17 - Because we own much of our manufacturing capacity, a significant portion of our operating cost is fixed. When factory loadings decrease, our fixed costs are spread over reduced output and, absent other circumstances, our profit margins decrease. Conversely, as factory loadings increase, our fixed costs are spread over increased output and, absent other circumstances, our profit margins increase. - For an explanation of free cash flow and the term "annual operating tax rate," see the Non-GAAP financial information section. - All dollar amounts in the tables are stated in millions of U.S. dollars. Our results of operations provides details of our financial results for 2021 and 2020 and year-to-year comparisons between 2021 and 2020 . Discussion of 2019 items and year-to-year comparisons between 2020 and 2019 that are not included in this Form 10-K can be found in "Management's discussion and analysis of financial condition and results of operations" in Part II, Item 7 of the Company's Annual Report on Form 10-K for the year ended December 31, 2020. The coronavirus (COVID-19) pandemic and its effects are impacting and will likely continue to impact market conditions and business operations across industries worldwide, including at TI. Therefore, we remain cautious about how the economy might behave for the next few years and continue to monitor potential impact on our operations. Results of operations Our strategic focus is on analog and embedded processing products sold into six end markets: industrial, automotive, personal electronics, communications equipment, enterprise systems and other. While all end markets represent good opportunities, we place additional strategic emphasis on designing and selling those products into the industrial and automotive markets, which we believe represent the best growth Our focus on analog and embedded processing allows us to generate strong cash flow from operations. Our cash flow from operations of $8.76 billion underscored the strength of our business model. Free cash flow was $6.29 billion and represented 34.3% of revenue. During 2021 , we returned $4.41 billion to shareholders through dividends and stock repurchases. Over the same period, our dividend represented 62% of free cash flow, underscoring its sustainability. Details of financial results - 2021 compared with 2020 Revenue of $18.34 billion increased $3.88 billion, or 27%, due to higher revenue from Analog and, to a lesser extent, Embedded Processing. Gross profit of $12.38 billion was up $3.11 billion, or 34%, primarily due to higher revenue. As a percentage of revenue, gross profit increased to 67.5% from 64.1%. Operating expenses (R\&D and SG\&A) were $3.22 billion compared with $3.15 billion. Acquisition charges were $142 million compared with $198 million and were non-cash. Restructuring charges/other was $54 million due to integration charges at our Lehi, Utah, manufacturing facility partially offset by gains on sales of assets, compared with $24 million due to an Embedded Processing action in 2020. Operating profit was $8.96 billion, or 48.8% of revenue, compared with $5.89 billion, or 40.8% of revenue. Other income and expense (OI\&E) was \$143 million of income compared with $313 million of income, which decreased primarily due to lower royalty income. See Note 11 to the financial statements. Our provision for income taxes was $1.15 billion compared with $422 million. This increase was due to higher income before income taxes and lower discrete tax benefits compared to 2020 , which included a $249 million benefit from the settlement of a depreciation-related uncertain tax position
Step by Step Solution
There are 3 Steps involved in it

Get step-by-step solutions from verified subject matter experts