

Question: Please answer all parts to this question, will leave a good review and like! Data table n Bank B 3.83 Bank A 2.86 2.53 3.64
Please answer all parts to this question, will leave a good review and like!
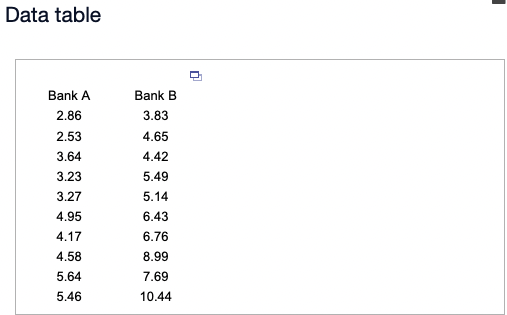
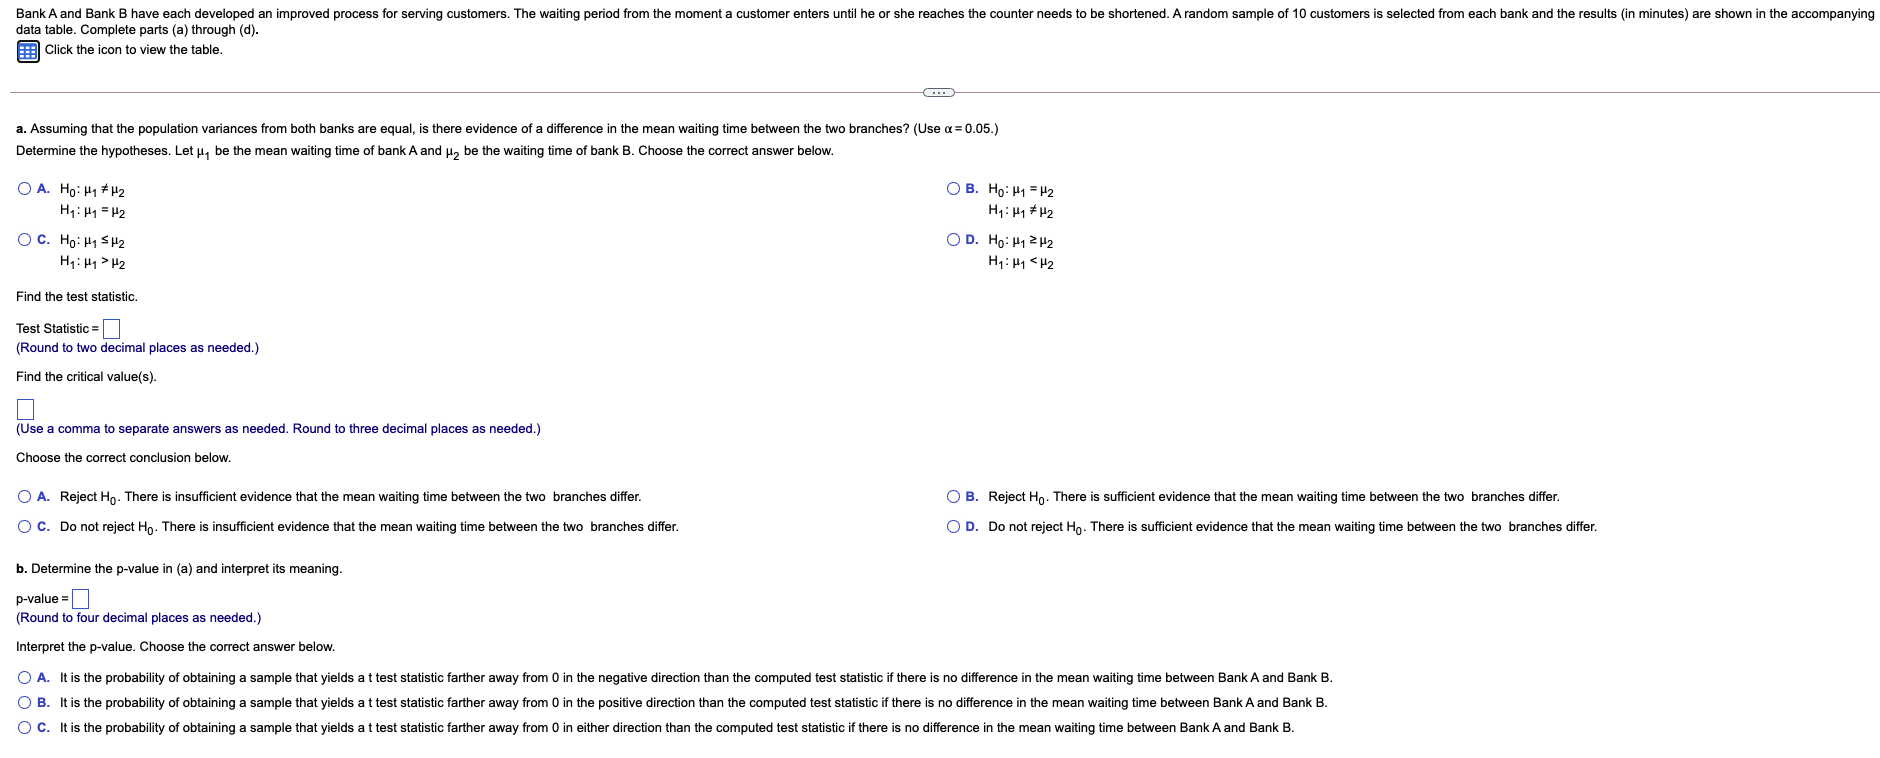
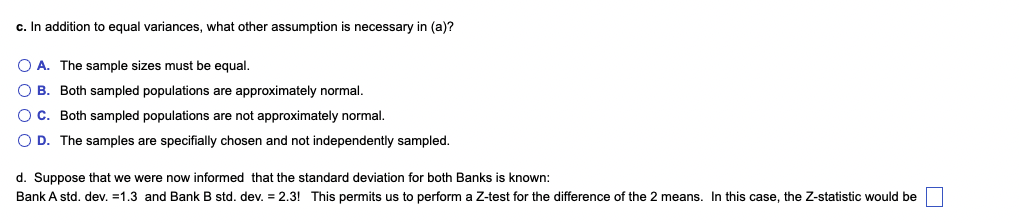
Data table n Bank B 3.83 Bank A 2.86 2.53 3.64 3.23 3.27 4.95 4.17 4.65 4.42 5.49 5.14 6.43 6.76 8.99 7.69 4.58 5.64 5.46 10.44 Bank A and Bank B have each developed an improved process for serving customers. The waiting period from the moment a customer enters until he or she reaches the counter needs to be shortened. A random sample of 10 customers is selected from each bank and the results in minutes) are shown in the accompanying data table. Complete parts (a) through (d). Click the icon to view the table. .. a. Assuming that the population variances from both banks are equal, is there evidence of a difference in the mean waiting time between the two branches? (Use a = 0.05.) Determine the hypotheses. Let Hy be the mean waiting time of bank A and Hy be the waiting time of bank B. Choose the correct answer below. O A. Ho: My #H2 H:H1 = -2 OB. Ho: H1 = 42 H:H1 H2 OC. Ho H1 H2 H:H1 H2 OD. Ho:11 212 H:H1 H2 Find the test statistic. Test Statistic (Round to two decimal places as needed.) Find the critical value(s). (Use a comma to separate answers as needed. Round to three decimal places as needed.) Choose the correct conclusion below. O A. Reject Ho. There is insufficient evidence that the mean waiting time between the two branches differ. OC. Do not reject Ho. There is insufficient evidence that the mean waiting time between the two branches differ. OB. Reject Ho. There is sufficient evidence that the mean waiting time between the two branches differ. OD. Do not reject Ho. There is sufficient evidence that the mean waiting time between the two branches differ. b. Determine the p-value in (a) and interpret its meaning. p-value (Round to four decimal places as needed.) Interpret the p-value. Choose the correct answer below. A. It is the probability of obtaining a sample that yields at test statistic farther away from 0 in the negative direction than the computed test statistic if there is no difference in the mean waiting time between Bank A and Bank B. OB. It is the probability of obtaining a sample that yields at test statistic farther away from 0 in the positive direction than the computed test statistic if there is no difference in the mean waiting time between Bank A and Bank B. OC. It is the probability of obtaining a sample that yields at test statistic farther away from 0 in either direction than the computed test statistic if there is no difference in the mean waiting time between Bank A and Bank B. c. In addition to equal variances, what other assumption is necessary in (a)? O A. The sample sizes must be equal. O B. Both sampled populations are approximately normal. O C. Both sampled populations are not approximately normal. OD. The samples are specifially chosen and not independently sampled. d. Suppose that we were now informed that the standard deviation for both Banks is known: Bank A std. dev. =1.3 and Bank B std. dev. = 2.3! This permits us to perform a Z-test for the difference of the 2 means. In this case, the Z-statistic would be = Data table n Bank B 3.83 Bank A 2.86 2.53 3.64 3.23 3.27 4.95 4.17 4.65 4.42 5.49 5.14 6.43 6.76 8.99 7.69 4.58 5.64 5.46 10.44 Bank A and Bank B have each developed an improved process for serving customers. The waiting period from the moment a customer enters until he or she reaches the counter needs to be shortened. A random sample of 10 customers is selected from each bank and the results in minutes) are shown in the accompanying data table. Complete parts (a) through (d). Click the icon to view the table. .. a. Assuming that the population variances from both banks are equal, is there evidence of a difference in the mean waiting time between the two branches? (Use a = 0.05.) Determine the hypotheses. Let Hy be the mean waiting time of bank A and Hy be the waiting time of bank B. Choose the correct answer below. O A. Ho: My #H2 H:H1 = -2 OB. Ho: H1 = 42 H:H1 H2 OC. Ho H1 H2 H:H1 H2 OD. Ho:11 212 H:H1 H2 Find the test statistic. Test Statistic (Round to two decimal places as needed.) Find the critical value(s). (Use a comma to separate answers as needed. Round to three decimal places as needed.) Choose the correct conclusion below. O A. Reject Ho. There is insufficient evidence that the mean waiting time between the two branches differ. OC. Do not reject Ho. There is insufficient evidence that the mean waiting time between the two branches differ. OB. Reject Ho. There is sufficient evidence that the mean waiting time between the two branches differ. OD. Do not reject Ho. There is sufficient evidence that the mean waiting time between the two branches differ. b. Determine the p-value in (a) and interpret its meaning. p-value (Round to four decimal places as needed.) Interpret the p-value. Choose the correct answer below. A. It is the probability of obtaining a sample that yields at test statistic farther away from 0 in the negative direction than the computed test statistic if there is no difference in the mean waiting time between Bank A and Bank B. OB. It is the probability of obtaining a sample that yields at test statistic farther away from 0 in the positive direction than the computed test statistic if there is no difference in the mean waiting time between Bank A and Bank B. OC. It is the probability of obtaining a sample that yields at test statistic farther away from 0 in either direction than the computed test statistic if there is no difference in the mean waiting time between Bank A and Bank B. c. In addition to equal variances, what other assumption is necessary in (a)? O A. The sample sizes must be equal. O B. Both sampled populations are approximately normal. O C. Both sampled populations are not approximately normal. OD. The samples are specifially chosen and not independently sampled. d. Suppose that we were now informed that the standard deviation for both Banks is known: Bank A std. dev. =1.3 and Bank B std. dev. = 2.3! This permits us to perform a Z-test for the difference of the 2 means. In this case, the Z-statistic would be =
Step by Step Solution
There are 3 Steps involved in it

Get step-by-step solutions from verified subject matter experts