

Question: Please answer all points 28. The following observations are for two quantitative variables, x and y. r Observation 1 2 3 4 5 72 99
Please answer all points 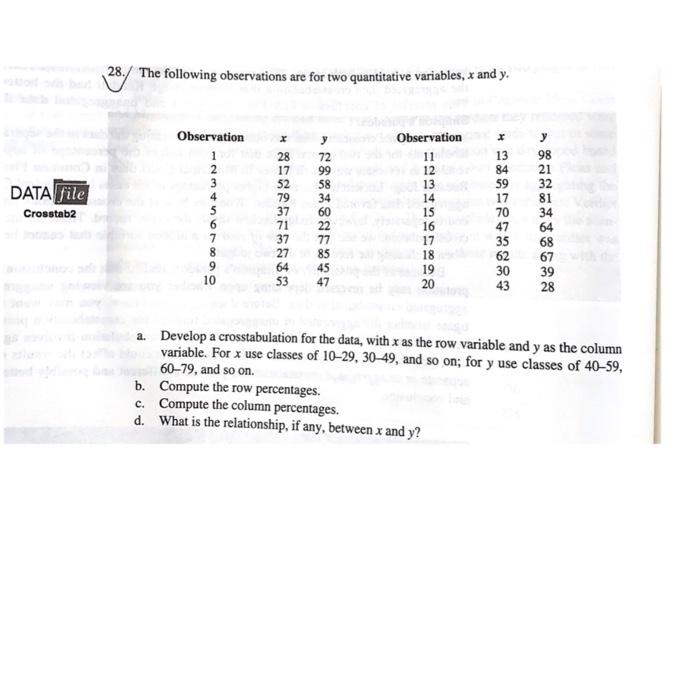
28. The following observations are for two quantitative variables, x and y. r Observation 1 2 3 4 5 72 99 58 DATA file Crosstab2 28 17 52 79 37 71 37 27 64 S3 Observation 11 12 13 14 15 16 17 34 60 22 77 85 45 47 13 84 59 17 70 47 35 62 30 43 y 98 21 32 81 34 64 68 67 39 28 8 18 10 19 20 a. Develop a crosstabulation for the data, with x as the row variable and y as the column variable. For x use classes of 10-29, 30-49, and so on; for y use classes of 40-59, 60-79, and so on. b. Compute the row percentages. c. Compute the column percentages. d. What is the relationship, if any, between x and y
Step by Step Solution
There are 3 Steps involved in it
1 Expert Approved Answer
Step: 1 Unlock

Question Has Been Solved by an Expert!
Get step-by-step solutions from verified subject matter experts
Step: 2 Unlock
Step: 3 Unlock