

Question: please answer all . Question 11 v A study was done to look at the relationship between number of lovers college students have had in
please answer all
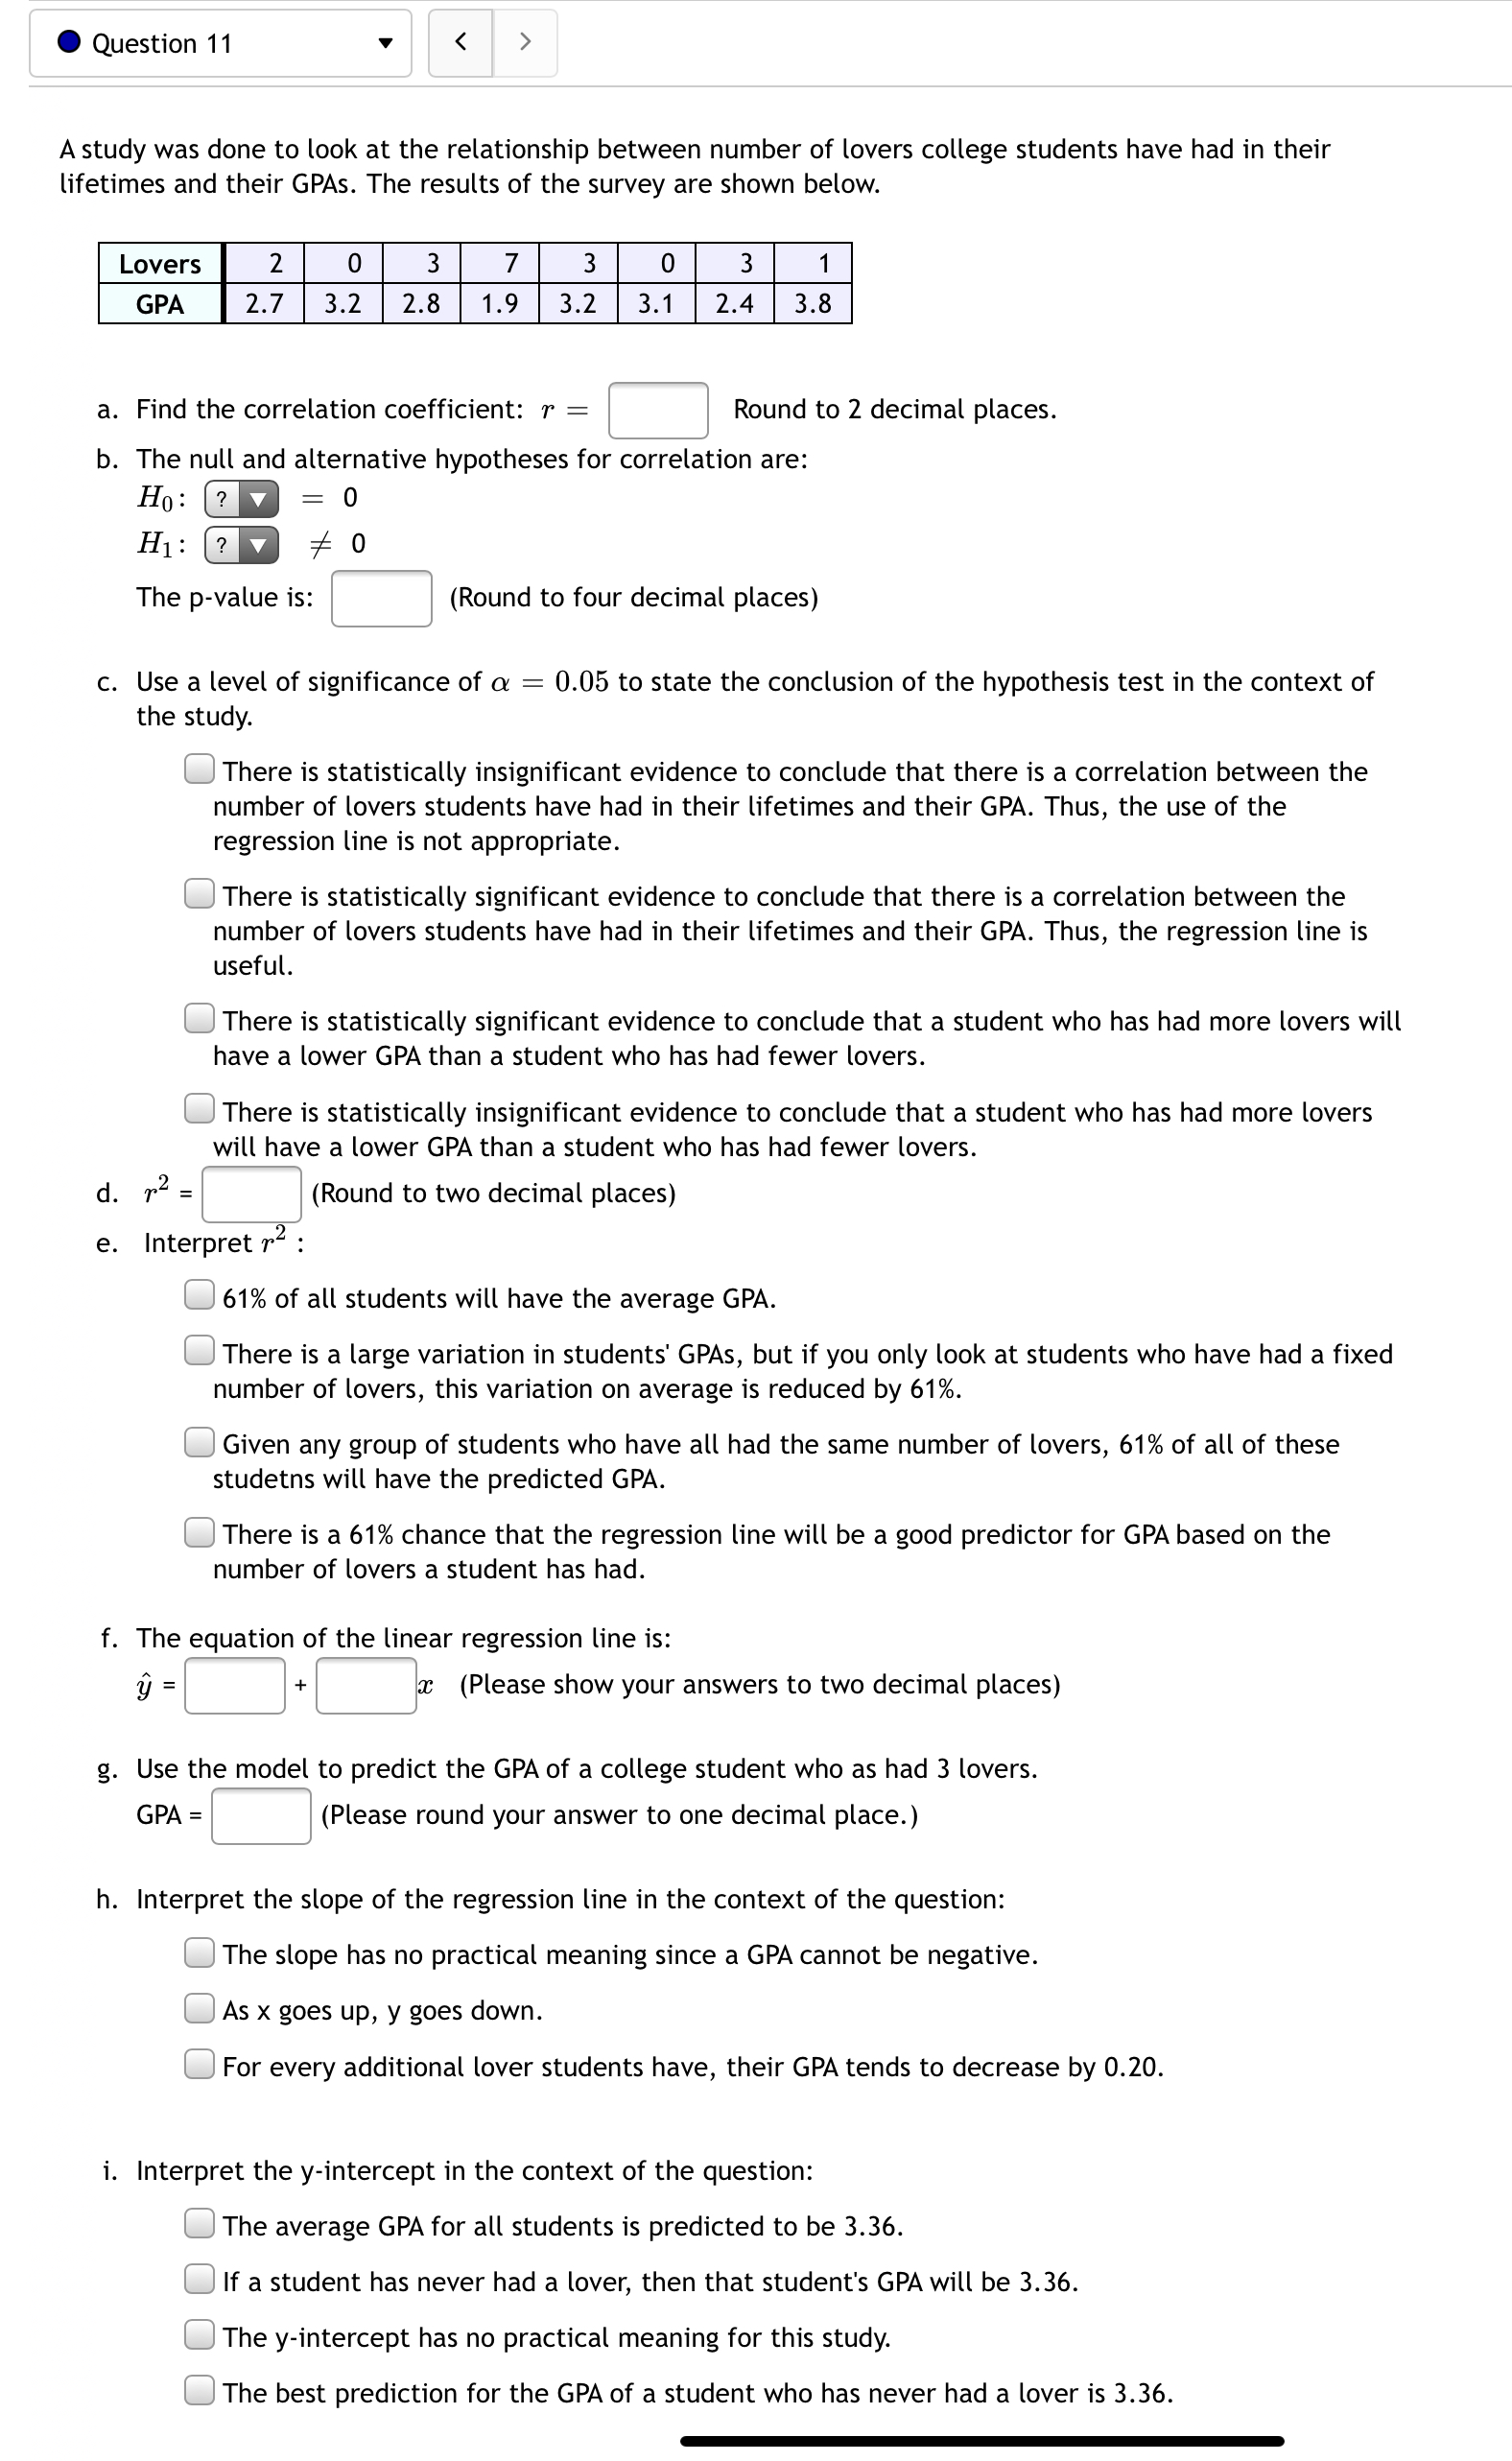
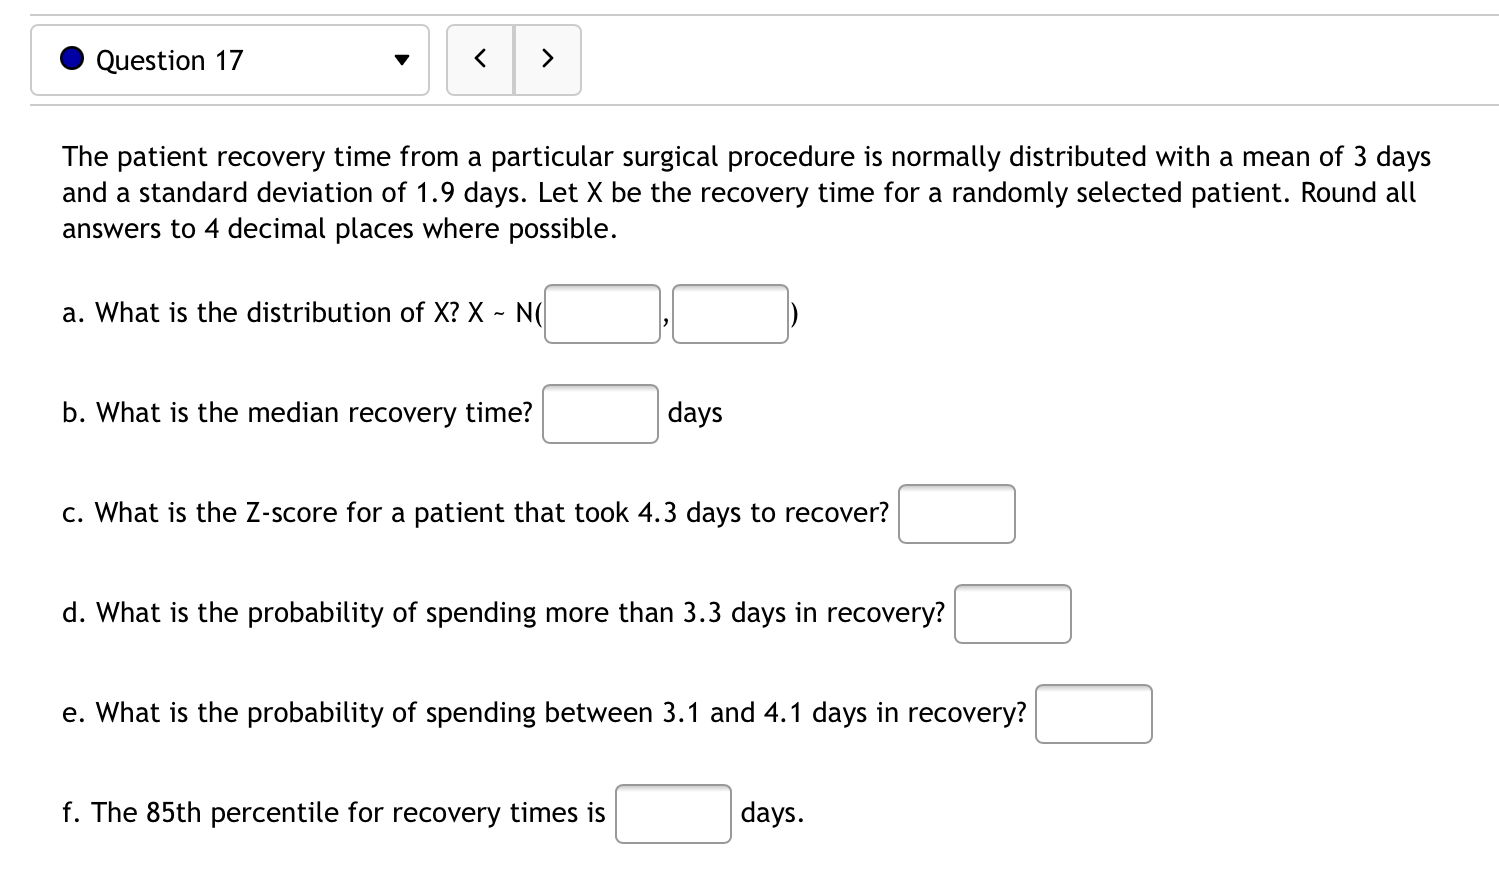
. Question 11 v A study was done to look at the relationship between number of lovers college students have had in their lifetimes and their GPAs. The results of the survey are shown below. Lovers 2 0 3 7 3 0 3 1 GPA 2.7 3.2 2.8 1.9 3.2 3.1 2.4 3.8 a. Find the correlation coefficient: r = C] Round to 2 decimal places. b. The null and alternative hypotheses for correlation are: Ho H1 :-=o .-,.o The p-value is: [3 (Round to four decimal places) c. Use a level of significance of as = 0.05 to state the conclusion of the hypothesis test in the context of the study. d. r2 C] There is statistically insignificant evidence to conclude that there is a correlation between the number of lovers students have had in their lifetimes and their GPA. Thus, the use of the regression line is not appropriate. C] There is statistically significant evidence to conclude that there is a correlation between the number of lovers students have had in their lifetimes and their GPA. Thus, the regression line is useful. C] There is statistically significant evidence to conclude that a student who has had more lovers will have a lower GPA than a student who has had fewer lovers. C] There is statistically insignificant evidence to conclude that a student who has had more lovers will have a lower GPA than a student who has had fewer lovers. = C] (Round to two decimal places) e. Interpret r2 : C] 61% of all students will have the average GPA. C] There is a large variation in students' GPAs, but if you only look at students who have had a fixed number of lovers, this variation on average is reduced by 61%. D Given any group of students who have all had the same number of lovers, 61% of all of these studetns will have the predicted GPA. C] There is a 61% chance that the regression line will be a good predictor for GPA based on the number of lovers a student has had. f. The equation of the linear regression line is: y: [j + Sm (Please show your answers to two decimal places) g. Use the model to predict the GPA of a college student who as had 3 lovers. GPA = C] (Please round your answer to one decimal place.) h. Interpret the slope of the regression line in the context of the question: C] The slope has no practical meaning since a GPA cannot be negative. C] As x goes up, y goes down. C] For every additional lover students have, their GPA tends to decrease by 0.20. i. Interpret the y-intercept in the context of the question: C] The average GPA for all students is predicted to be 3.36. D If a student has never had a lover, then that student's GPA will be 3.36. D The y-intercept has no practical meaning for this study. B The best prediction for the GPA of a student who has never had a lover is 3.36. 0 Question 17 v The patient recovery time from a particular surgical procedure is normally distributed with a mean of 3 days and a standard deviation of 1.9 days. Let X be the recovery time for a randomly selected patient. Round all answers to 4 decimal places where possible. a. What is the distribution of X? X ~ N([:,[:]) b. What is the median recovery time? [3 days c. What is the Z-score for a patient that took 4.3 days to recover? [:] d. What is the probability of spending more than 3.3 days in recovery? [:J e. What is the probability of spending between 3.1 and 4.1 days in recovery? C] f. The 85th percentile for recovery times is [:] days
Step by Step Solution
There are 3 Steps involved in it

Get step-by-step solutions from verified subject matter experts