

Question: please answer all Question 2 (20 marks) Figure 2 shows the process flow diagram for a bulk chemical production and Table 2 shows the summary
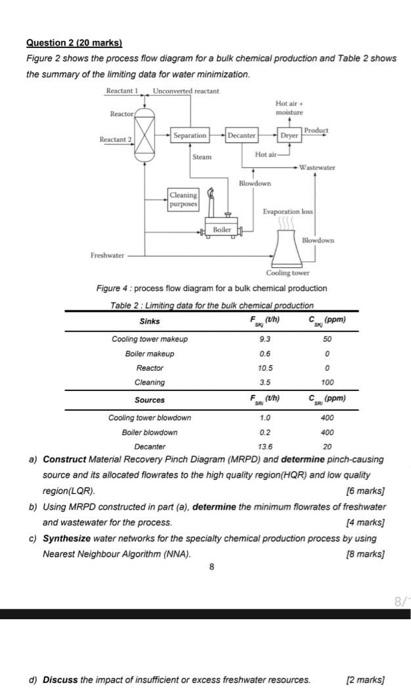
Question 2 (20 marks) Figure 2 shows the process flow diagram for a bulk chemical production and Table 2 shows the summary of the limiting data for water minimization. Figure 4 ; process flow diagram for a bulk chemical peoduction a) Construct Materiat Recovery Pinch Diagram (MRPD) and determine pinch-causing source and its allocated flowrates to the high quality region(HQR) and low quality region (LQR). [6 marks] b) Using MRPD constructed in part (a), determine the minimum flowrates of freshwater and wastewater for the process. [4 marks] c) Synthesize water networks for the specialty chemical production process by using Nearest Neighbour Algorithm (NNA). [8 marks] 8 d) Discuss the impact of insufficient or excess freshwater resources. [2 marks]
Step by Step Solution
There are 3 Steps involved in it

Get step-by-step solutions from verified subject matter experts