

Question: Please answer all question with Excel formulas. thank you A cash flow diagram for the project is provided. Years Initial Cost Salvage Op Costs Benefits
Please answer all question with Excel formulas. thank you
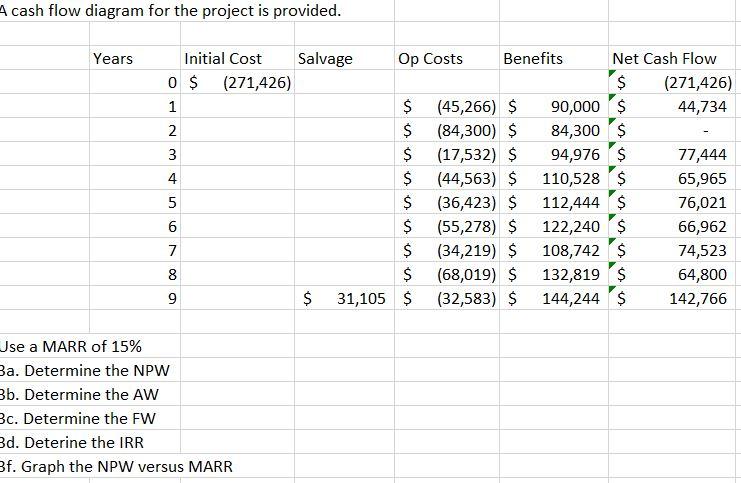
A cash flow diagram for the project is provided. Years Initial Cost Salvage Op Costs Benefits Net Cash Flow 0 $ (271,426) $ (271,426) 1 $ (45,266) $ 90,000 $ 44,734 2 $ (84,300) $ 84,300 $ 3 $ (17,532) $ 94,976 $ 77,444 4 $ (44,563) $ 110,528$ 65,965 5 $ (36,423) $ 112,444 $ 76,021 6 $ (55,278) $ 122,240$ 66,962 7 $ (34,219) $ 108,742 $ 74,523 8 $ (68,019) $ 132,819 $ 64,800 $ 31,105 $ (32,583) $ 144,244 $ 142,766 D Use a MARR of 15% Ba. Determine the NPW Bb. Determine the AW Bc. Determine the FW Bd. Deterine the IRR Bf. Graph the NPW versus MARR A cash flow diagram for the project is provided. Years Initial Cost Salvage Op Costs Benefits Net Cash Flow 0 $ (271,426) $ (271,426) 1 $ (45,266) $ 90,000 $ 44,734 2 $ (84,300) $ 84,300 $ 3 $ (17,532) $ 94,976 $ 77,444 4 $ (44,563) $ 110,528$ 65,965 5 $ (36,423) $ 112,444 $ 76,021 6 $ (55,278) $ 122,240$ 66,962 7 $ (34,219) $ 108,742 $ 74,523 8 $ (68,019) $ 132,819 $ 64,800 $ 31,105 $ (32,583) $ 144,244 $ 142,766 D Use a MARR of 15% Ba. Determine the NPW Bb. Determine the AW Bc. Determine the FW Bd. Deterine the IRR Bf. Graph the NPW versus MARR
Step by Step Solution
There are 3 Steps involved in it

Get step-by-step solutions from verified subject matter experts