

Question: Please answer all questions in depth for learning purposes. Analyze the data in Exhibit 5, comparing the data for the two companies. Explain why you
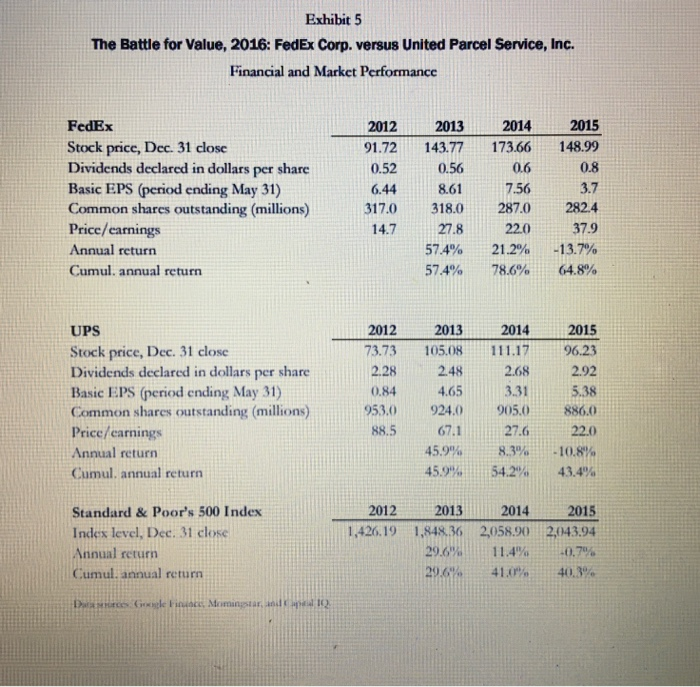
Analyze the data in Exhibit 5, comparing the data for the two companies. Explain why you think the stock prices of the two companies have behaved the way they have. Explain why the market has assigned a higher pricelearnings ratio to FedEx than it has to UPS Exhibit 5 The Battle for Value, 2016: FedEx Corp. versus United Parcel Service, Inc. Financial and Market Performance FedEx Stock price, Dec. 31 close Dividends declared in dollars per share Basic EPS (period ending May 31) Common shares outstanding (millions) Price/earnings Annual return Cumul. annual return 2012 91.72 0.52 6.44 317.0 14.7 2013 143.77 0.56 8 .61 318.0 27.8 57.4% 57.4% 2014 173.66 0.6 7.56 287.0 22.0 21.2% 78.6% 2015 148.99 0.8 3.7 282.4 37.9 -13.7% 64.8% 2014 111.17 UPS Stock price, Dec. 31 close Dividends declared in dollars per share Basic EPS (period ending May 31) Common shares outstanding (millions) Price/carnings Annual return Cumul, annual return 2012 73.73 2.28 0.84 953.0 2.68 2013 105.08 2.48 4.65 924.0 67.1 45.9% 45.9% 2015 96.23 2.92 5.38 886.0 22.0 -10.8% 43.4% 88.5 905.0 27.6 8.3% 54.2% 2012 1,426,19 Standard & Poor's 500 Index Index level, Dec. 31 close Annual return Cumul. annual return 2013 1,848.36 29.6% 29.6% 2014 2,058.90 11.4% 41.0% 2015 2,043.94 0,7% 40.3% Da Cone Finance, Momingstar, and
Step by Step Solution
There are 3 Steps involved in it

Get step-by-step solutions from verified subject matter experts