

Question: please answer all questions Question 2 The following table is showing historical returns for shares called Gama and Delta from 2017 to 2021. By using
please answer all questions 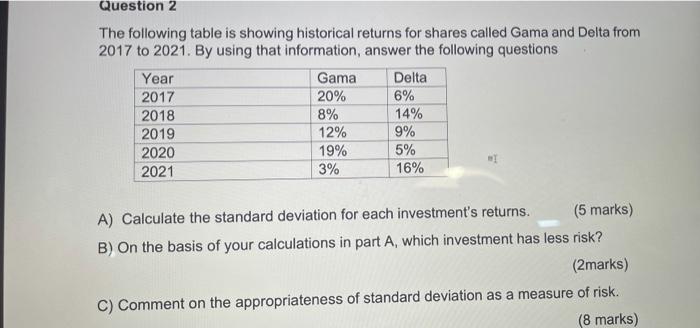
Question 2 The following table is showing historical returns for shares called Gama and Delta from 2017 to 2021. By using that information, answer the following questions Year Gama Delta 2017 20% 6% 2018 8% 14% 2019 12% 9% 2020 19% 5% 2021 3% 16% A) Calculate the standard deviation for each investment's returns. (5 marks) B) On the basis of your calculations in part A, which investment has less risk? (2marks) C) Comment on the appropriateness of standard deviation as a measure of risk. (8 marks)
Step by Step Solution
There are 3 Steps involved in it
1 Expert Approved Answer
Step: 1 Unlock

Question Has Been Solved by an Expert!
Get step-by-step solutions from verified subject matter experts
Step: 2 Unlock
Step: 3 Unlock