

Question: please answer all questions. QUESTION 3 The following stem-and-leaf plot represent marks (out of 100) distribution for third assessment of a certain STA404 class. 3
please answer all questions.
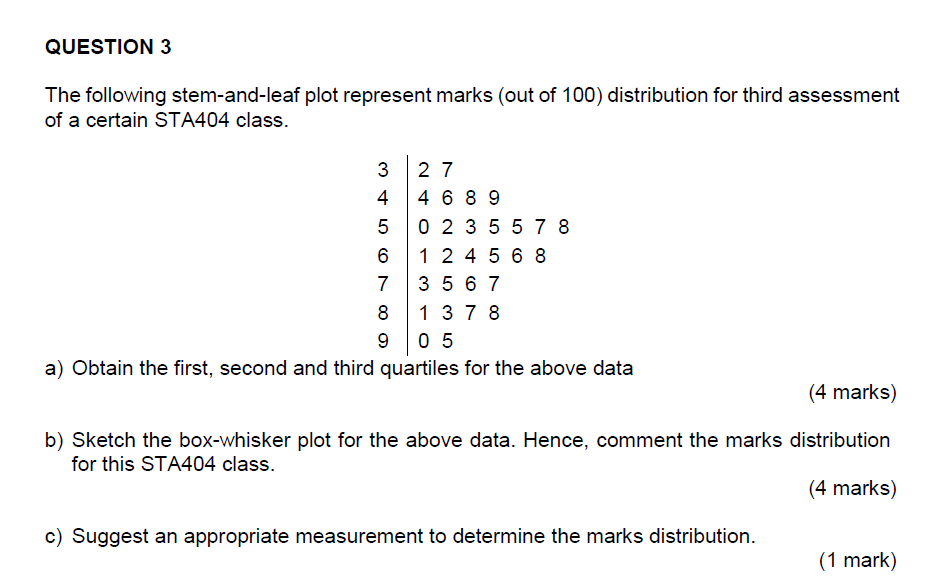
QUESTION 3 The following stem-and-leaf plot represent marks (out of 100) distribution for third assessment of a certain STA404 class. 3 2 7 4 4 68 9 5 0 2 3 5 5 7 8 1 24 568 I O 7 3567 8 137 8 9 0 5 a) Obtain the first, second and third quartiles for the above data (4 marks) b) Sketch the box-whisker plot for the above data. Hence, comment the marks distribution for this STA404 class. (4 marks) c) Suggest an appropriate measurement to determine the marks distribution. (1 mark)
Step by Step Solution
There are 3 Steps involved in it
1 Expert Approved Answer
Step: 1 Unlock

Question Has Been Solved by an Expert!
Get step-by-step solutions from verified subject matter experts
Step: 2 Unlock
Step: 3 Unlock