

Question: please answer all questions. STATISTICS FOR BUSINESS AND SOCIAL SCIENCES Question Mark ASSESSMENT 2 1 l 15 2 I 10 3 I S ANSWER ALL
please answer all questions.
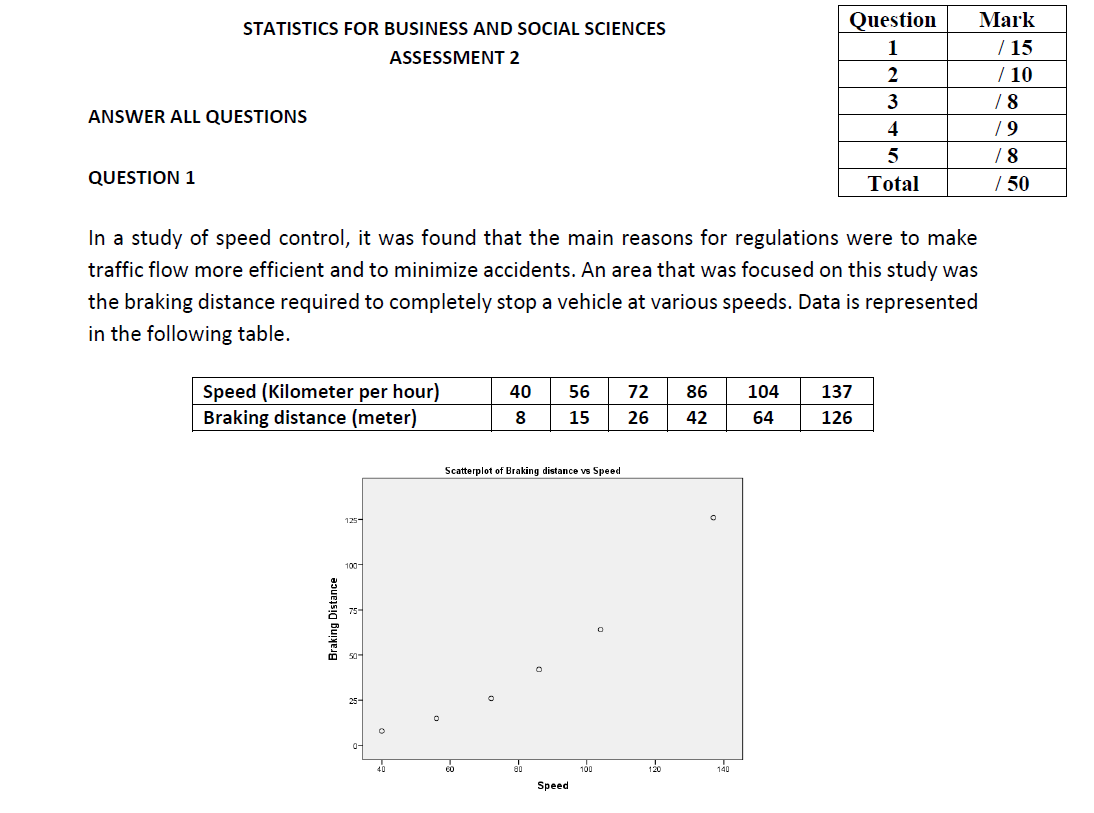
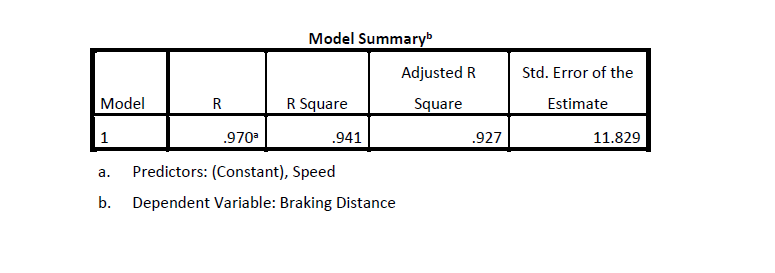
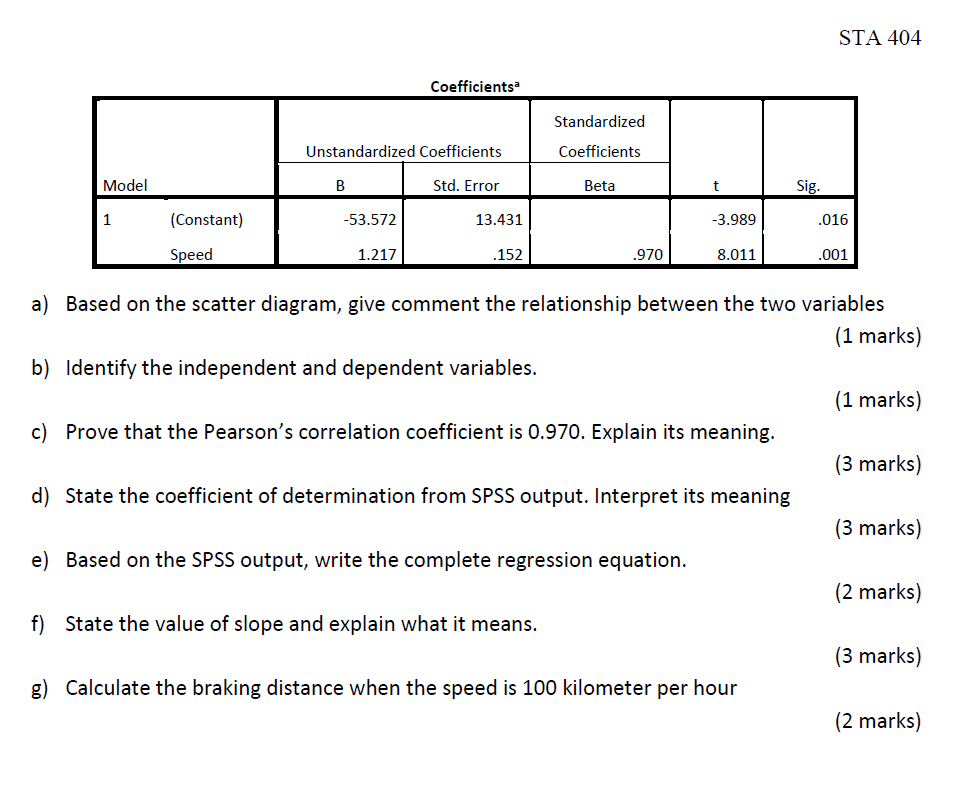
STATISTICS FOR BUSINESS AND SOCIAL SCIENCES Question Mark ASSESSMENT 2 1 l 15 2 I 10 3 I S ANSWER ALL QUESTIONS 4 I 9 5 I S QUESTION 1 Total I; 50 In a study of speed control, it was found that the main reasons for regulations were to make traffic flow more efficient and to minimize accidents. An area that was focused on this study was the braking distance required to completely stop a vehicle at various speeds. Data is represented in the following table. Speed {Kilometer per hour) 40 56 72 86 104 137 Braking distance (meter) 8 15 26 42 64 126 ScmrPIol ofEmkilIg did-nee III Speed 5 D In so- Model Summaryb Adjusted R Std. Error of the Model R R Square Square Estimate 1 .970a .941 .927 11.829 a. Predictors: (Constant), Speed b. Dependent Variable: Braking Distancef} a) STA 404 Coefficientsa Standardized U nstandardized Coefficients Coefficients __ t gig. 1 {Consta nt] 63.5?2 13.43 1 3.939 .016 Speed 1.21? .152 .970 8.011 .001 Based on the scatter diagram, give comment the relationship between the two variables (1 marks) Identify the independent and dependent variables. (1 marks) Prove that the Pearson's correlation coefficient is 0.970. Explain its meaning. (3 marks) State the coefficient of determination from SPSS output. Interpret its meaning (3 marks) Based on the SPSS output. write the complete regression equation. (2 marks) State the value of slope and explain what it means. (3 marks) Calculate the braking distance when the speed is 100 kilometer per hour (2 marks)
Step by Step Solution
There are 3 Steps involved in it

Get step-by-step solutions from verified subject matter experts