Question: please answer all the questions A radar chart visually shows the size of gaps among current vs. ideal performance. True False Question 6 (1 point)

please answer all the questions please answer all the questions A radar chart
A radar chart visually shows the size of gaps among current vs. ideal performance. True False Question 6 (1 point) An alternative in a decision matrix has a cost of $20,000, lowest cost in the list of alternatives is $10,000, 'total cost' would be: O 0.5 2.5 02 O 10 Question 7 (1 point) Which tool (or technique) would you use to graphically represent current performance measures vs. ideal performance measures, all in one visual? Radar chart O Pareto chart Check sheet Run chart

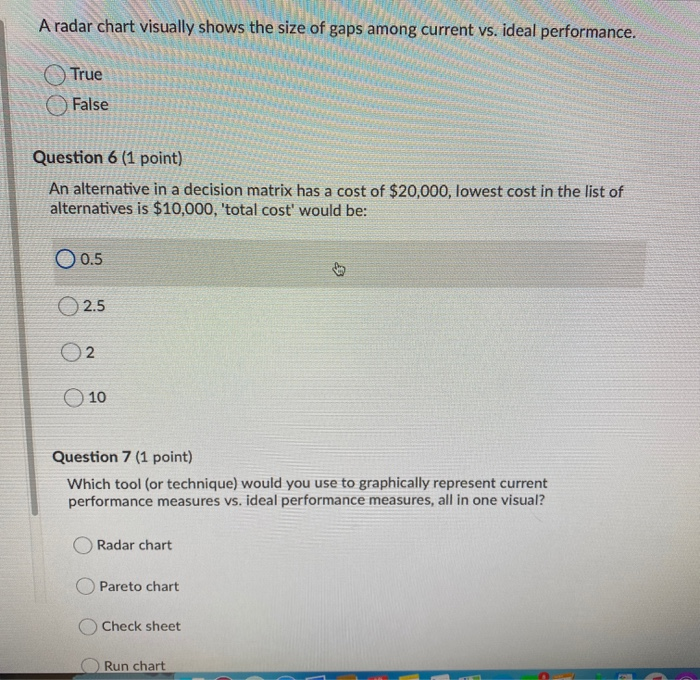
Step by Step Solution

There are 3 Steps involved in it

1 Expert Approved Answer
Step: 1 Unlock blur-text-image
Question Has Been Solved by an Expert!

Get step-by-step solutions from verified subject matter experts

Step: 2 Unlock
Step: 3 Unlock

Students Have Also Explored These Related General Management Questions!