

Question: Please answer all the questions and boxes as well correctly. 1. The null hypothesis is H0: H1 = [.12 and the alternative hypothesis is as
Please answer all the questions and boxes as well correctly.
1.
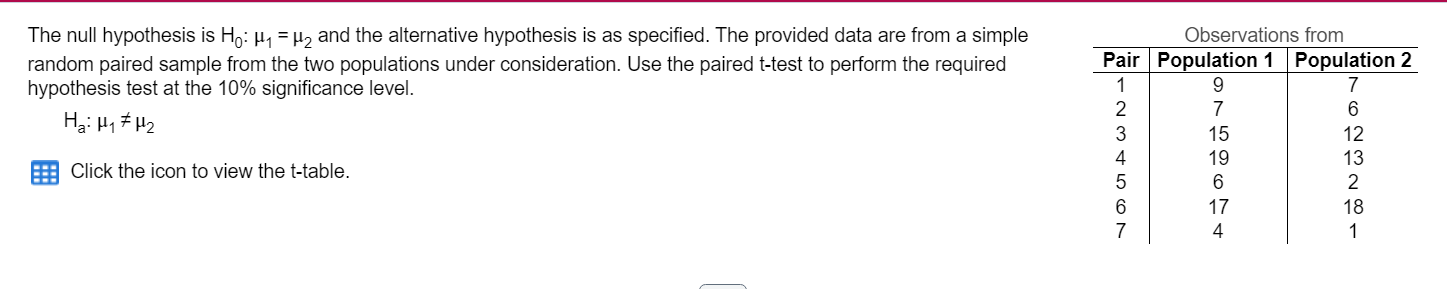
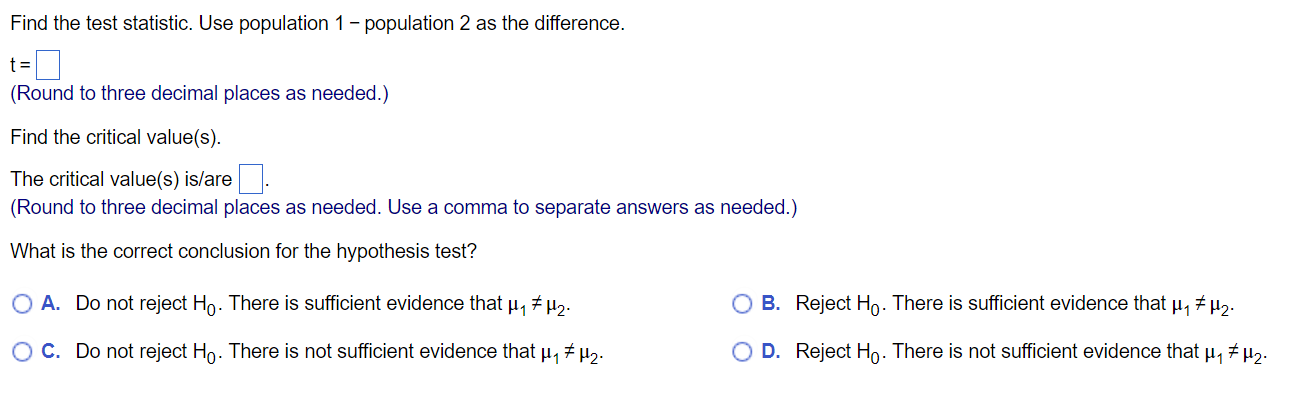
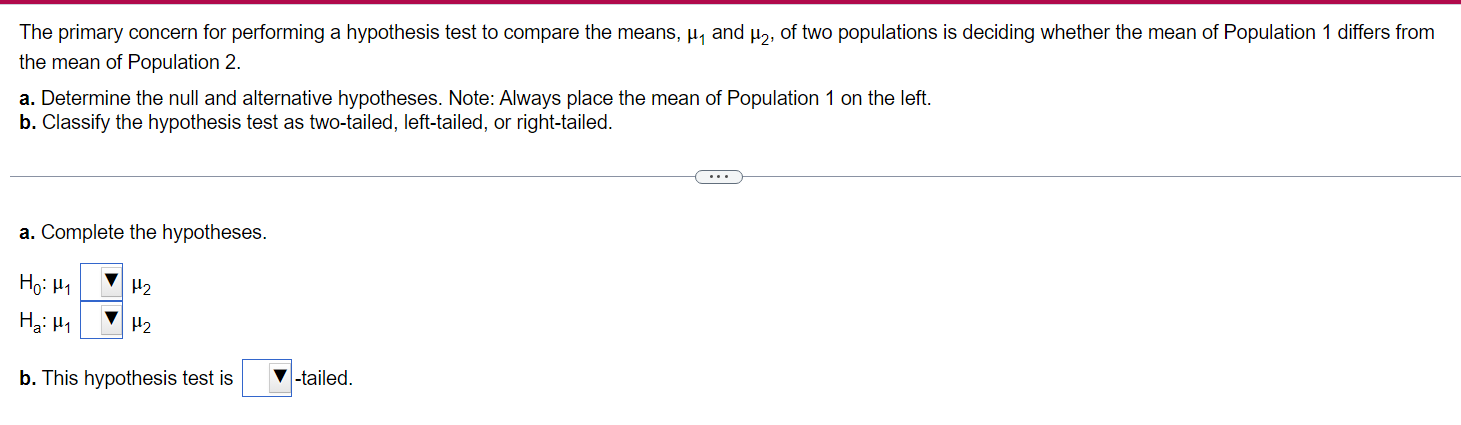
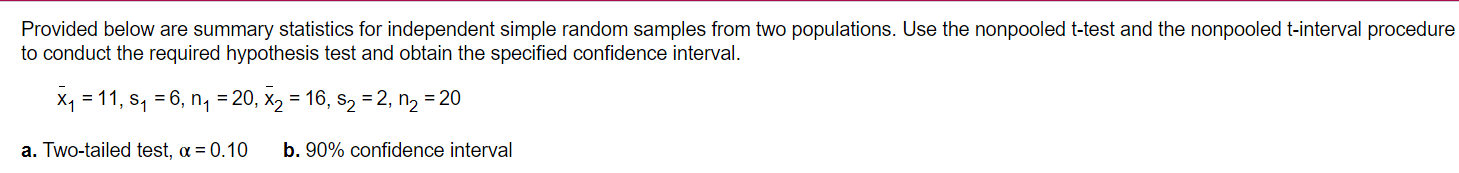
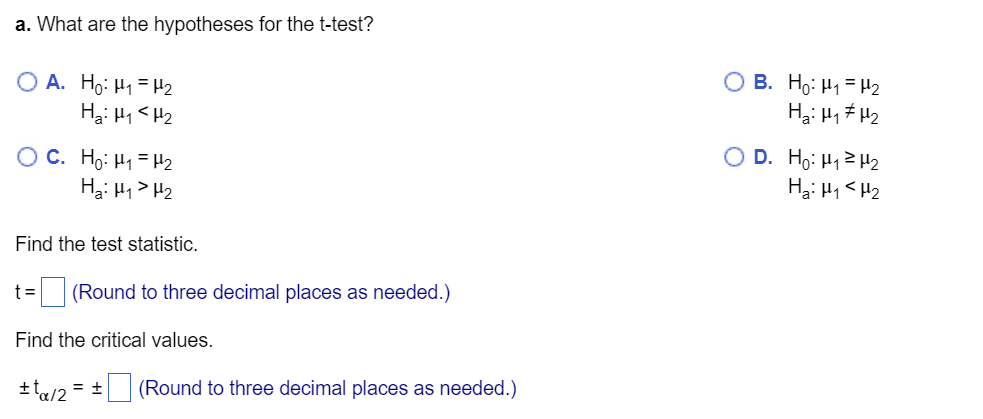
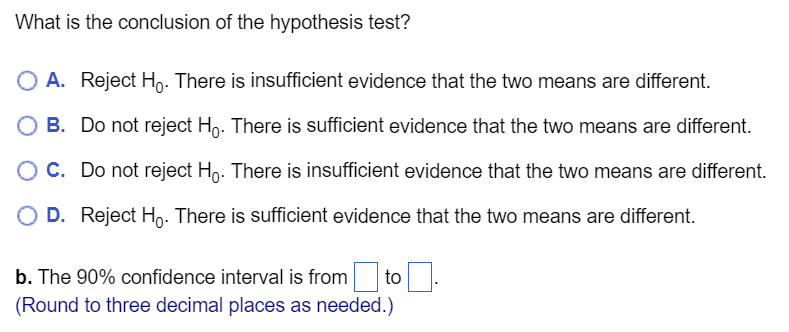

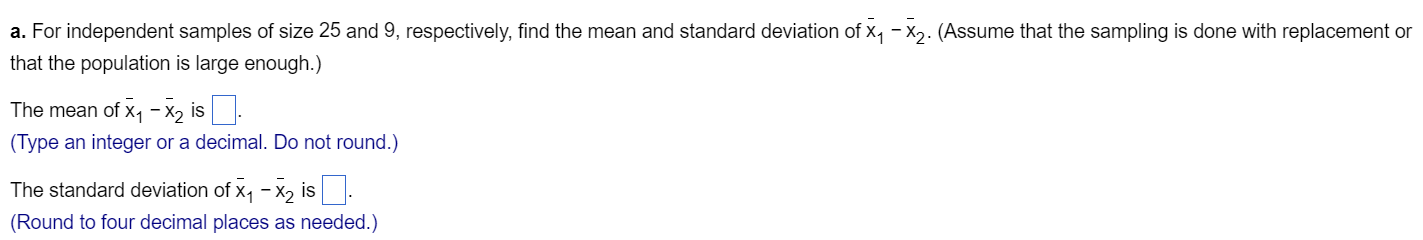
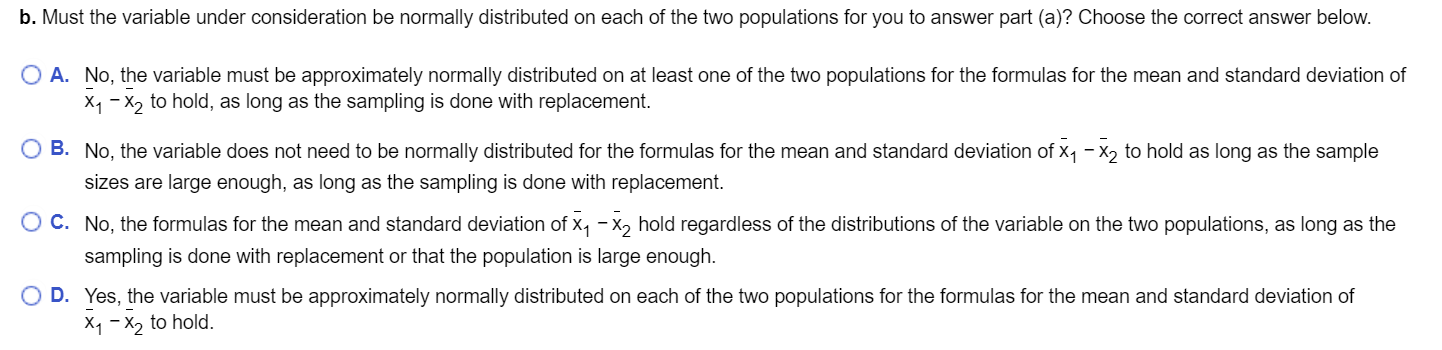
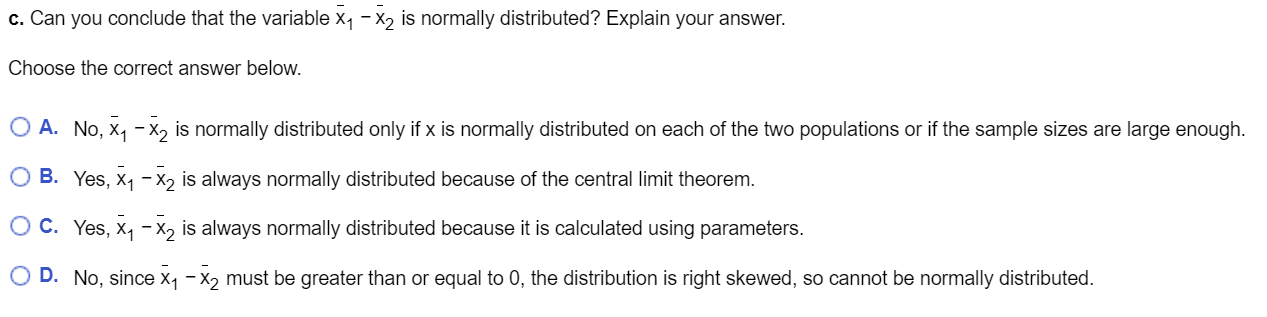
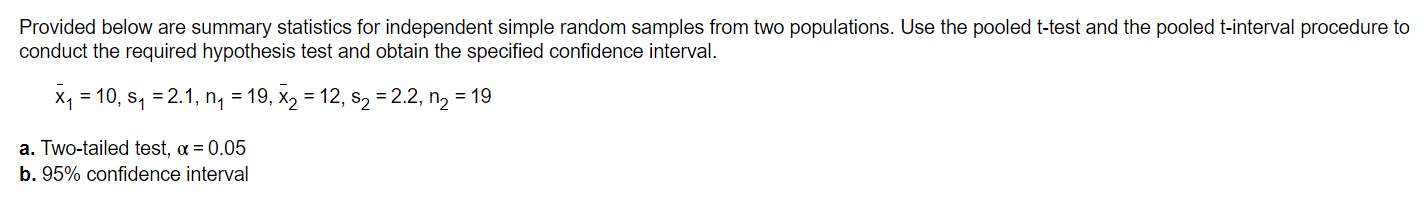
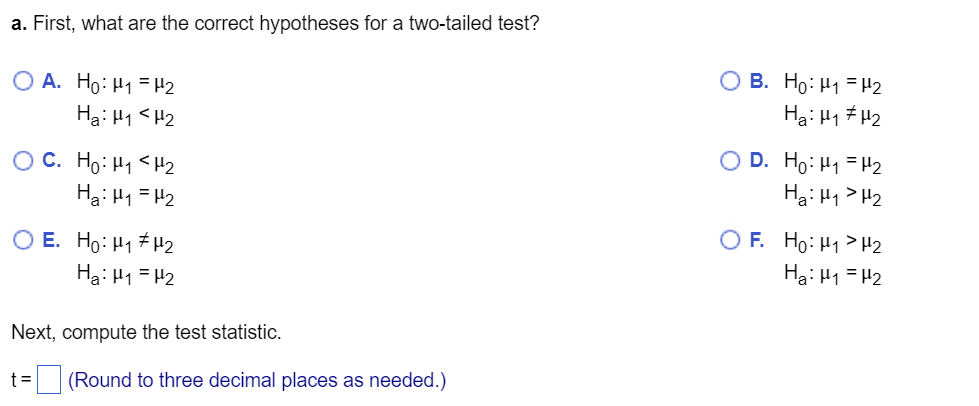
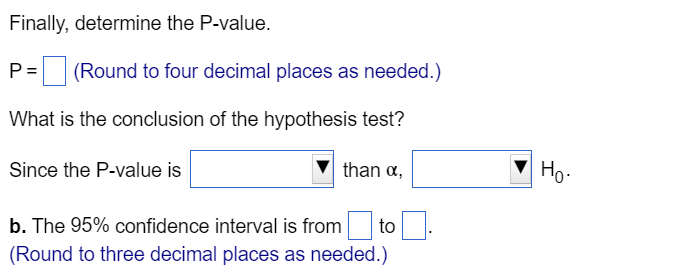
The null hypothesis is H0: H1 = [.12 and the alternative hypothesis is as specied. The provided data are from a simple Observations from random paired sample from the two populations under consideration. Use the paired t-test to perform the required Pair Population 1 Population 2 hypothesis test at the 10% significance level. 1 9 7 . 2 7 5 Ha\" \"1 \"2 3 15 12 . . . 4 19 13 a Click the Icon to viewthet-table. 5 6 2 6 17 18 7 4 1 Find the test statistic. Use population 1 - population 2 as the difference. t = (Round to three decimal places as needed.) Find the critical value(s). The critical value(s) is/are (Round to three decimal places as needed. Use a comma to separate answers as needed.) What is the correct conclusion for the hypothesis test? O A. Do not reject Ho. There is sufficient evidence that , # H2. O B. Reject Ho. There is sufficient evidence that , # 12. O C. Do not reject Ho. There is not sufficient evidence that , # #2. O D. Reject Ho. There is not sufficient evidence that , # H2.The primary concern for performing a hypothesis test to compare the means, p1 and p2. of two populations is deciding whether the mean of Population 1 differs from the mean of Population 2. a. Determine the null and alternative hypotheses. Note: Always place the mean of Population 1 on the left. b. Classify the hypothesis test as two-tailed, left-tailed, or right-tailed. a. Complete the hypotheses. H0411 V \"2 Hat: \"1 V \"2 b. This hypothesis test is V -tai|ed. Provided below are summary statistics for independent simple random samples from two populations. Use the nonpooled t-test and the nonpooled t-interval procedure to conduct the required hypothesis test and obtain the specified confidence interval. Xy = 11, S1 = 6, n1 = 20, X2 = 16, $2 = 2, n2 = 20 a. Two-tailed test, a = 0.10 b. 90% confidence intervala. What are the hypotheses for the t-test? Li A. H0411: pg iui B. H0: 1.11 = p2 Ha:u1 H2 Ha: H1 = H2 OF. HO: H 1 > H2 OE. HO: Hq # H2 Ha: H1 = H2 Ha: H1 = H2 Next, compute the test statistic. t = (Round to three decimal places as needed.)Finally, determine the P-value. P = (Round to four decimal places as needed.) What is the conclusion of the hypothesis test? Since the P-Value is V than 0:, b. The 95% confidence interval is from I to (Round to three decimal places as needed.)
Step by Step Solution
There are 3 Steps involved in it

Get step-by-step solutions from verified subject matter experts