

Question: Please answer all the questions. The pick options are: a. moderate b. strong c. weak Below is the link and downloaded spreadsheet Spreadsheet: this link
Please answer all the questions.
The pick options are:
a. moderate
b. strong
c. weak
Below is the link and downloaded spreadsheet
Spreadsheet:
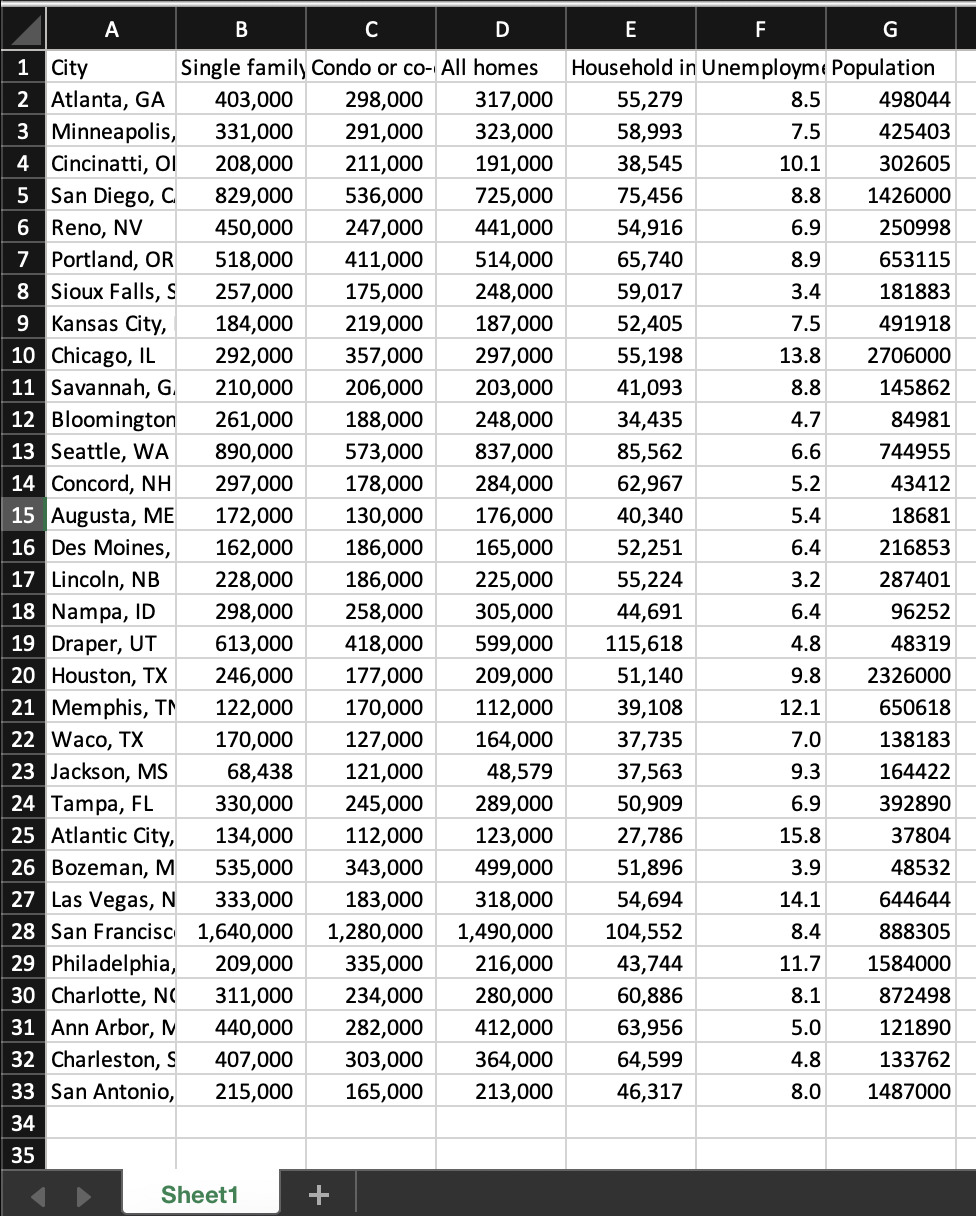
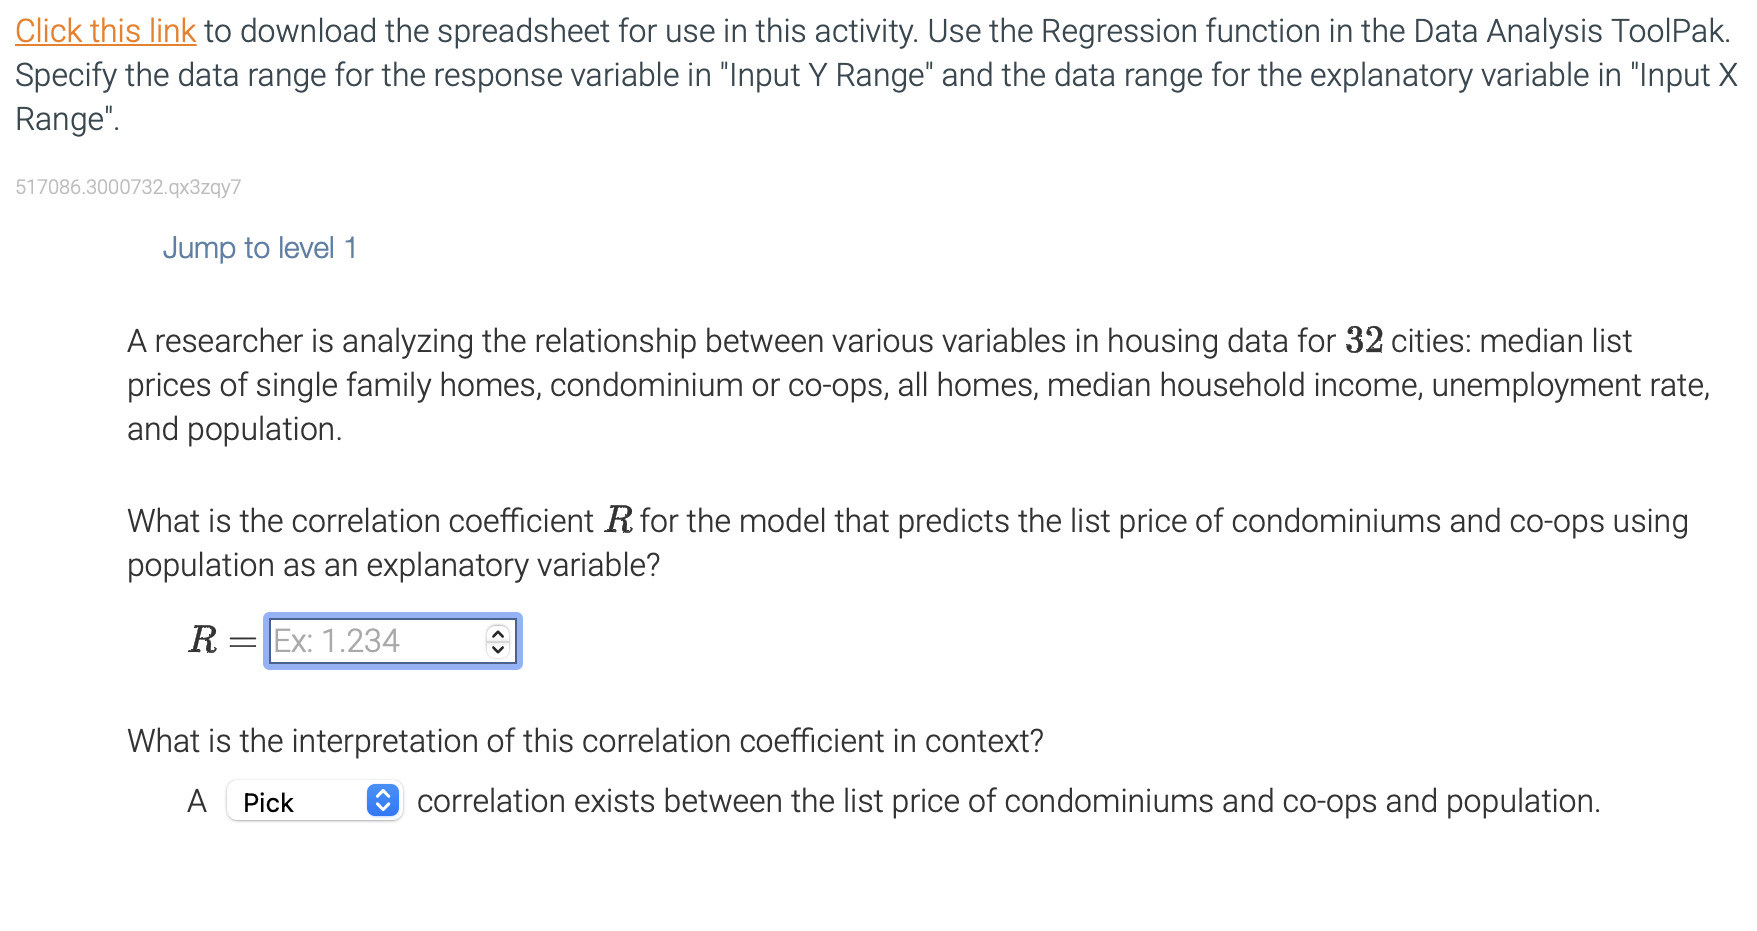
this link to download the spreadsheet for use in this activity. Use the Regression function in the Data Analysis ToolPak. fy the data range for the response variable in "Input Y Range" and the data range for the explanatory variable in "Input X en. 3000732.93zqy7 Jump to level 1 A researcher is analyzing the relationship between various variables in housing data for 32 cities: median list prices of single family homes, condominium or co-ops, all homes, median household income, unemployment rate, and population. What is the correlation coefficient R for the model that predicts the list price of condominiums and co-ops using population as an explanatory variable? R= What is the interpretation of this correlation coefficient in context? A correlation exists between the list price of condominiums and co-ops and population. \begin{tabular}{|c|c|c|c|c|c|c|c|} \hline & A & B & C & D & E & F & G \\ \hline 1 & City & \multicolumn{2}{|c|}{ Single famil) Condo or co- } & All homes & \multicolumn{3}{|c|}{ Household in Unemploym Population } \\ \hline 2 & Atlanta, GA & 403,000 & 298,000 & 317,000 & 55,279 & 8.5 & 498044 \\ \hline 3 & Minneapolis, & 331,000 & 291,000 & 323,000 & 58,993 & 7.5 & 425403 \\ \hline 4 & Cincinatti, OI & 208,000 & 211,000 & 191,000 & 38,545 & 10.1 & 302605 \\ \hline 5 & San Diego, C & 829,000 & 536,000 & 725,000 & 75,456 & 8.8 & 1426000 \\ \hline 6 & Reno, NV & 450,000 & 247,000 & 441,000 & 54,916 & 6.9 & 250998 \\ \hline 7 & Portland, OR & 518,000 & 411,000 & 514,000 & 65,740 & 8.9 & 653115 \\ \hline 8 & Sioux Falls, S & 257,000 & 175,000 & 248,000 & 59,017 & 3.4 & 181883 \\ \hline 9 & Kansas City, & 184,000 & 219,000 & 187,000 & 52,405 & 7.5 & 491918 \\ \hline 10 & Chicago, IL & 292,000 & 357,000 & 297,000 & 55,198 & 13.8 & 2706000 \\ \hline 11 & Savannah, G. & 210,000 & 206,000 & 203,000 & 41,093 & 8.8 & 145862 \\ \hline 12 & Bloomington & 261,000 & 188,000 & 248,000 & 34,435 & 4.7 & 84981 \\ \hline 13 & Seattle, WA & 890,000 & 573,000 & 837,000 & 85,562 & 6.6 & 744955 \\ \hline 14 & Concord, NH & 297,000 & 178,000 & 284,000 & 62,967 & 5.2 & 43412 \\ \hline 15 & Augusta, ME & 172,000 & 130,000 & 176,000 & 40,340 & 5.4 & 18681 \\ \hline 16 & Des Moines, & 162,000 & 186,000 & 165,000 & 52,251 & 6.4 & 216853 \\ \hline 17 & Lincoln, NB & 228,000 & 186,000 & 225,000 & 55,224 & 3.2 & 287401 \\ \hline 18 & Nampa, ID & 298,000 & 258,000 & 305,000 & 44,691 & 6.4 & 96252 \\ \hline 19 & Draper, UT & 613,000 & 418,000 & 599,000 & 115,618 & 4.8 & 48319 \\ \hline 20 & Houston, TX & 246,000 & 177,000 & 209,000 & 51,140 & 9.8 & 2326000 \\ \hline 21 & Memphis, Tr & 122,000 & 170,000 & 112,000 & 39,108 & 12.1 & 650618 \\ \hline 22 & Waco, TX & 170,000 & 127,000 & 164,000 & 37,735 & 7.0 & 138183 \\ \hline 23 & Jackson, MS & 68,438 & 121,000 & 48,579 & 37,563 & 9.3 & 164422 \\ \hline 24 & Tampa, FL & 330,000 & 245,000 & 289,000 & 50,909 & 6.9 & 392890 \\ \hline 25 & Atlantic City, & 134,000 & 112,000 & 123,000 & 27,786 & 15.8 & 37804 \\ \hline 26 & Bozeman, M & 535,000 & 343,000 & 499,000 & 51,896 & 3.9 & 48532 \\ \hline 27 & Las Vegas, N & 333,000 & 183,000 & 318,000 & 54,694 & 14.1 & 644644 \\ \hline 28 & San Francisc & 1,640,000 & 1,280,000 & 1,490,000 & 104,552 & 8.4 & 888305 \\ \hline 29 & Philadelphia, & 209,000 & 335,000 & 216,000 & 43,744 & 11.7 & 1584000 \\ \hline 30 & Charlotte, NC & 311,000 & 234,000 & 280,000 & 60,886 & 8.1 & 872498 \\ \hline 31 & Ann Arbor, N & 440,000 & 282,000 & 412,000 & 63,956 & 5.0 & 121890 \\ \hline 32 & Charleston, S & 407,000 & 303,000 & 364,000 & 64,599 & 4.8 & 133762 \\ \hline 33 & San Antonio, & 215,000 & 165,000 & 213,000 & 46,317 & 8.0 & 1487000 \\ \hline 34 & & & & & & & \\ \hline 35 & & & & & & & \\ \hline \end{tabular}
Step by Step Solution
There are 3 Steps involved in it

Get step-by-step solutions from verified subject matter experts