

Question: PLEASE ANSWER ALL WITH THE CORRECT SOLUTION. Figure 1 shows costs distribution for a construction project and Figure 2 shows the payment schedule for the
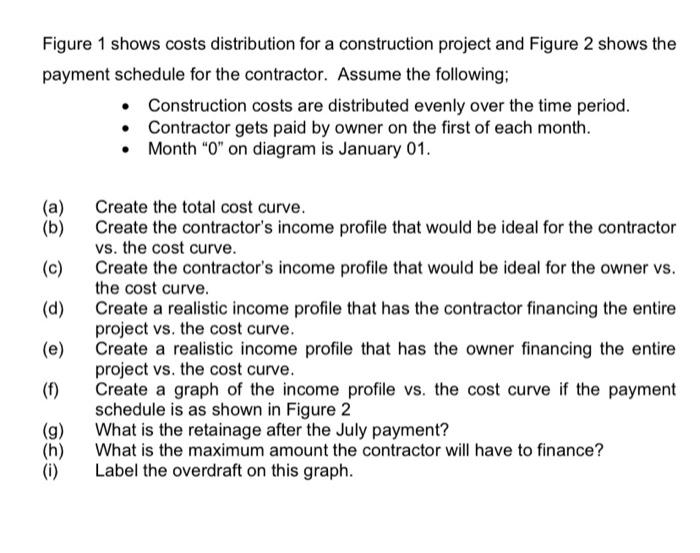
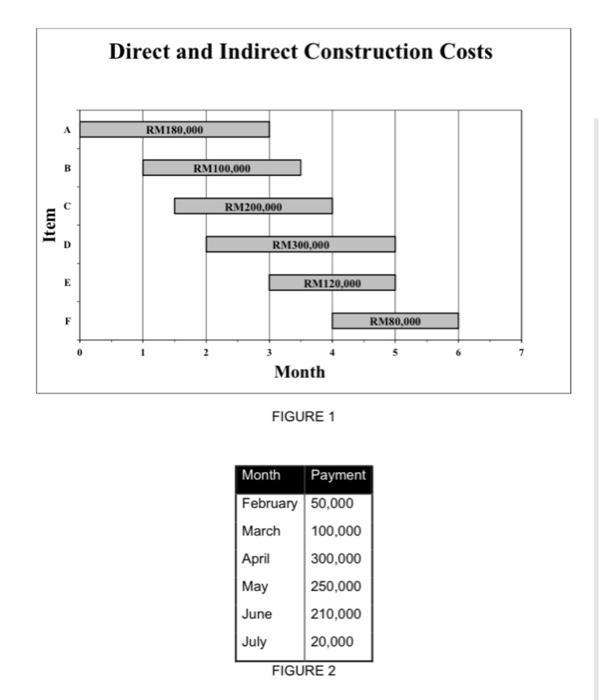
Figure 1 shows costs distribution for a construction project and Figure 2 shows the payment schedule for the contractor. Assume the following; Construction costs are distributed evenly over the time period. Contractor gets paid by owner on the first of each month. Month "0" on diagram is January 01. (a) (b) (c) (d) (e) Create the total cost curve. Create the contractor's income profile that would be ideal for the contractor vs. the cost curve. Create the contractor's income profile that would be ideal for the owner vs. the cost curve. Create a realistic income profile that has the contractor financing the entire project vs. the cost curve. Create a realistic income profile that has the owner financing the entire project vs. the cost curve. Create a graph of the income profile vs. the cost curve if the payment schedule is as shown in Figure 2 What is the retainage after the July payment? What is the maximum amount the contractor will have to finance? Label the overdraft on this graph. (f) (g) (0) Direct and Indirect Construction Costs A RM180.000 B RM100,000 RM200,000 Item D RM300.000 E RM120.000 F RM80.000 Month FIGURE 1 Month Payment February 50,000 March 100,000 April 300,000 May 250,000 June 210,000 July 20,000 FIGURE 2
Step by Step Solution
There are 3 Steps involved in it

Get step-by-step solutions from verified subject matter experts