

Question: Please answer and show how you arrived at your Answer a. Thankyou Question 7 In 2014, students in an advanced Statistics course at UC Berkeley
Please answer and show how you arrived at your Answer a. Thankyou
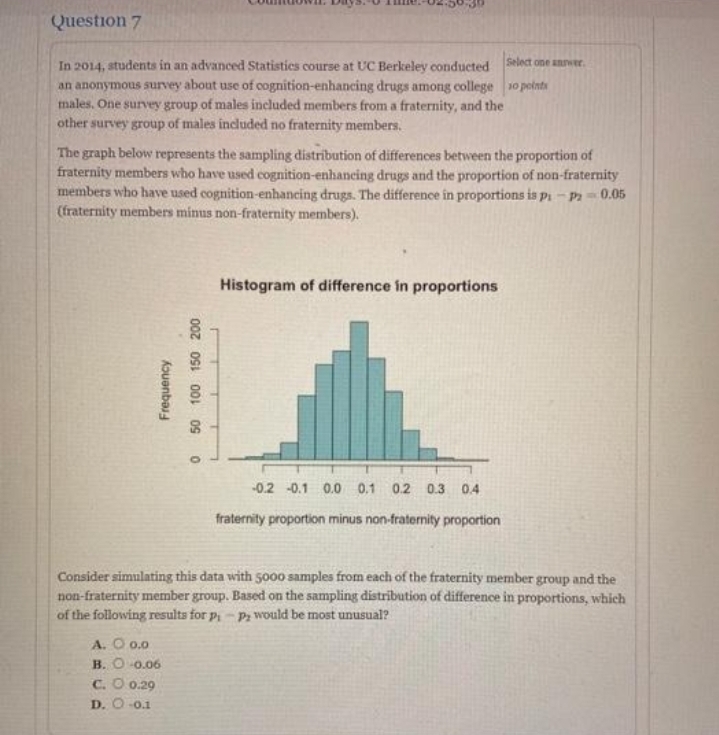
Question 7 In 2014, students in an advanced Statistics course at UC Berkeley conducted Select one career. an anonymous survey about use of cognition-enhancing drugs among college opera males. One survey group of males included members from a fraternity, and the other survey group of males included no fraternity members. The graph below represents the sampling distribution of differences between the proportion of fraternity members who have used cognition-enhancing drugs and the proportion of non-fraternity members who have used cognition-enhancing drugs. The difference in proportions is p; - pa = 0.05 (fraternity members minus non-fraternity members). Histogram of difference in proportions 50 100 150 200 Frequency 0 -0.2 0.1 0.0 0.1 0.2 03 04 fraternity proportion minus non-fraternity proportion Consider simulating this data with 5000 samples from each of the fraternity member group and the non-fraternity member group. Based on the sampling distribution of difference in proportions, which of the following results for p, - p, would be most unusual? A. Q.o.0 B. O-0.06 C. O.0.29 D. O-01In the article Coffee, Caffeine, and Risk of Depression Among Women in the Select one answer. September 2011 edition of the Archives of Internal Medicine, researchers to points investigated the relationship between caffeine consumption and depression among women. The participants in this study were older, with substantially lower rates of depression when compared to female teens. Researchers compared two groups of women (among others) in this study: those who do not drink coffee and those who routinely drink 4 or more cups of coffee each day. For the following question, a coffee drinker is a woman who drinks four or more cups each day. The depression rate for women who do not drink coffee is 6%. For the moment, we assume that this is the rate for coffee drinkers as well. We plan to survey 920 women who drink coffee and 1100 women who do not. We will determine the proportion of women who are depressed in each sample. Will the sampling distribution of differences between sample proportions be approximately normal? A. O Yes, a normal model is a good fit for this sampling distribution. B. O No, a normal model is not a good fit for this sampling distribution
Step by Step Solution
There are 3 Steps involved in it

Get step-by-step solutions from verified subject matter experts