

Question: Please answer and show me how you got the missing answers for this, thank you Analysis and Interpretation of Profitability Balance sheets and income statements
Please answer and show me how you got the missing answers for this, thank you
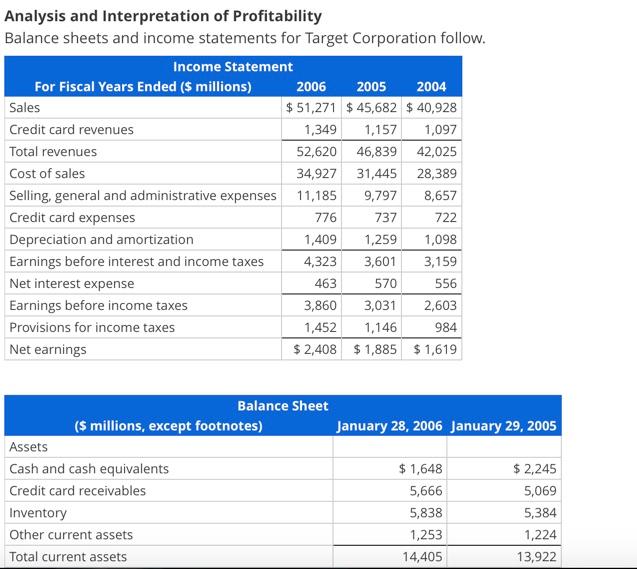
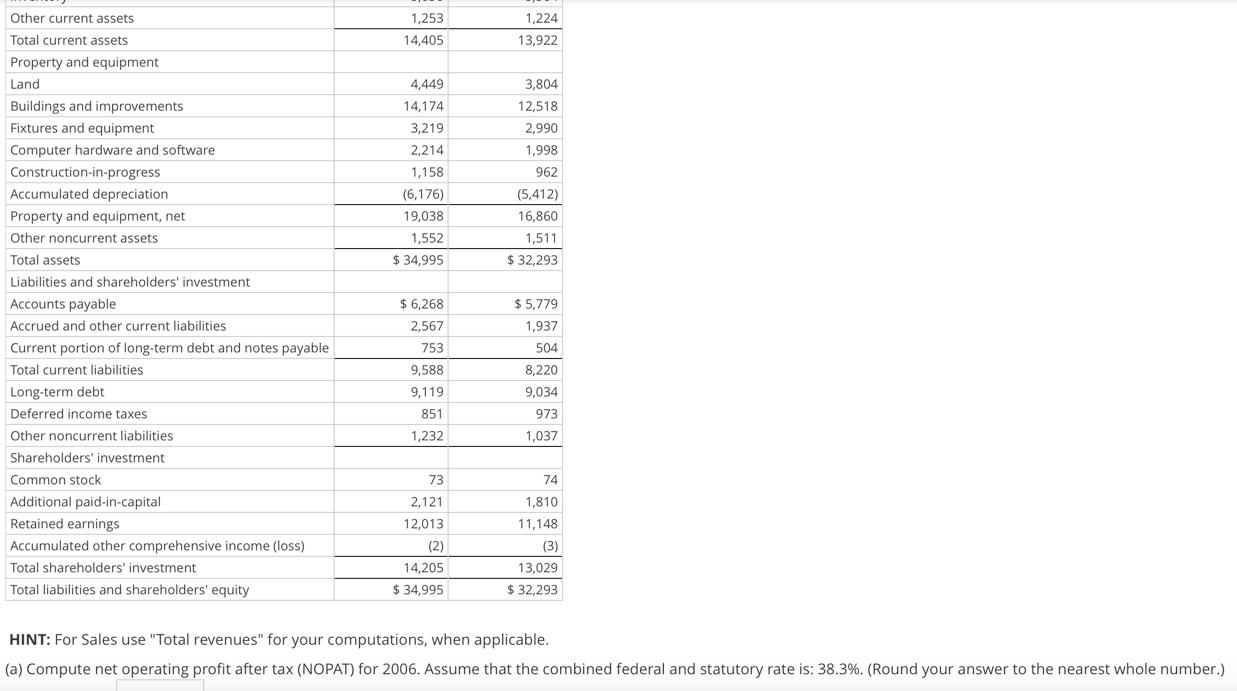
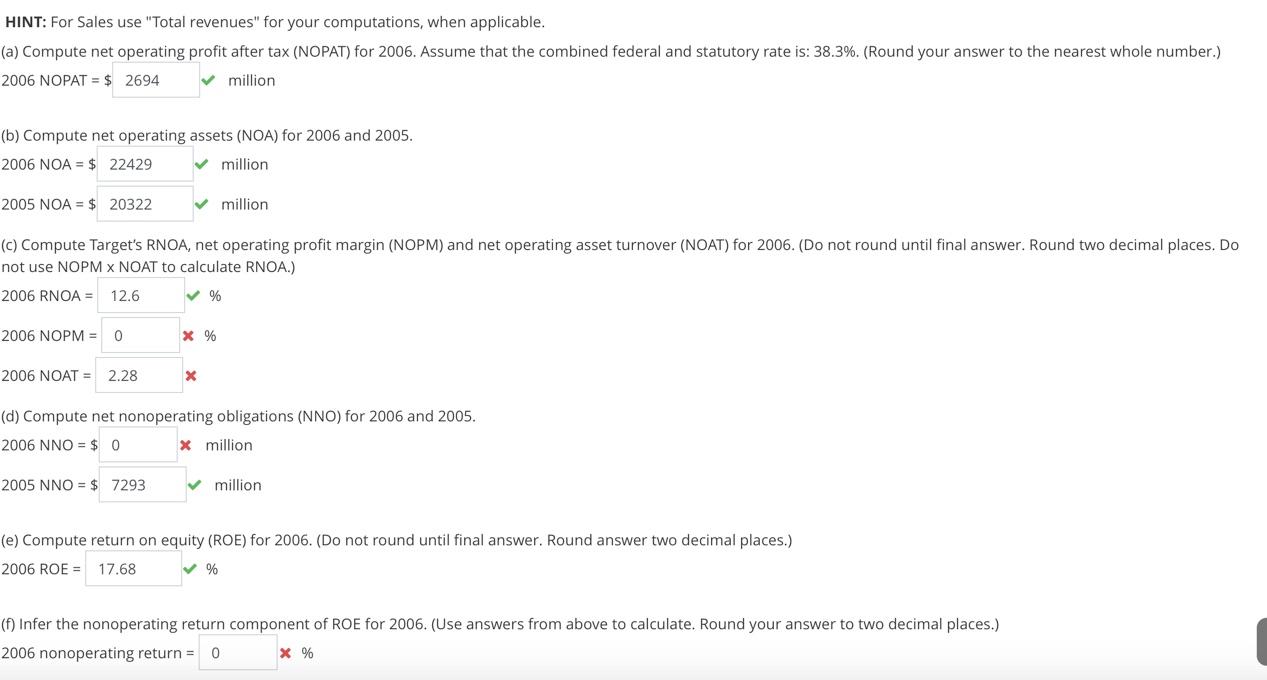
Analysis and Interpretation of Profitability Balance sheets and income statements for Target Corporation follow. Income Statement For Fiscal Years Ended ($ millions) 2006 2005 2004 Sales $ 51,271 $ 45,682 $ 40,928 Credit card revenues 1,349 1,157 1,097 Total revenues 52,620 46,839 42,025 Cost of sales 34,927 31,445 28,389 Selling, general and administrative expenses 11,185 9,797 8,657 Credit card expenses 776 737 722 Depreciation and amortization 1,409 1,259 1,098 Earnings before interest and income taxes 4,323 3,601 3,159 Net interest expense 463 570 556 Earnings before income taxes 3,860 3,031 2,603 Provisions for income taxes 1,452 1,146 984 Net earnings $ 2,408 $1,885 $1,619 Balance Sheet ($ millions, except footnotes) January 28, 2006 January 29, 2005 Assets Cash and cash equivalents $1,648 $ 2,245 Credit card receivables 5,666 5,069 Inventory 5,838 5,384 Other current assets 1,253 1,224 Total current assets 14,405 13,922 1,253 1,224 13,922 14,405 3,804 12,518 2.990 1,998 4,449 14,174 3,219 2,214 1,158 (6,176) 19,038 1,552 $ 34,995 962 (5,412) 16,860 1,511 $ 32,293 Other current assets Total current assets Property and equipment Land Buildings and improvements Fixtures and equipment Computer hardware and software Construction-in-progress Accumulated depreciation Property and equipment, net Other noncurrent assets Total assets Liabilities and shareholders' investment Accounts payable Accrued and other current liabilities Current portion of long-term debt and notes payable Total current liabilities Long-term debt Deferred income taxes Other noncurrent liabilities Shareholders' investment Common stock Additional paid-in-capital Retained earnings Accumulated other comprehensive income (loss) Total shareholders' investment Total liabilities and shareholders' equity $5,779 1,937 $ 6,268 2,567 753 9,588 9,119 851 1,232 504 8,220 9,034 973 1,037 73 74 2,121 12,013 (2) 14,205 $ 34,995 1,810 11,148 (3) 13,029 $ 32,293 HINT: For Sales use "Total revenues" for your computations, when applicable. (a) Compute net operating profit after tax (NOPAT) for 2006. Assume that the combined federal and statutory rate is: 38.3%. (Round your answer to the nearest whole number.) HINT: For Sales use "Total revenues" for your computations, when applicable. (a) Compute net operating profit after tax (NOPAT) for 2006. Assume that the combined federal and statutory rate is: 38.3%. (Round your answer to the nearest whole number.) 2006 NOPAT = $ 2694 million (b) Compute net operating assets (NOA) for 2006 and 2005. 2006 NOA = $ 22429 million 2005 NOA = $ 20322 million (c) Compute Target's RNOA, net operating profit margin (NOPM) and net operating asset turnover (NOAT) for 2006. (Do not round until final answer. Round two decimal places. Do not use NOPM x NOAT to calculate RNOA.) 2006 RNOA = 12.6 % 2006 NOPM = 0 X % 2006 NOAT = 2.28 x (d) Compute net nonoperating obligations (NNO) for 2006 and 2005. 2006 NNO = $ 0 X million 2005 NNO = $ 7293 million (e) Compute return on equity (ROE) for 2006. (Do not round until final answer. Round answer two decimal places.) 2006 ROE = 17.68 % (1) Infer the nonoperating return component of ROE for 2006. (Use answers from above to calculate. Round your answer to two decimal places.) 2006 nonoperating return = 0 X %
Step by Step Solution
There are 3 Steps involved in it

Get step-by-step solutions from verified subject matter experts